
Chapter 7: Formal Reports
- Page ID
- 179215
\( \newcommand{\vecs}[1]{\overset { \scriptstyle \rightharpoonup} {\mathbf{#1}} } \)
\( \newcommand{\vecd}[1]{\overset{-\!-\!\rightharpoonup}{\vphantom{a}\smash {#1}}} \)
\( \newcommand{\dsum}{\displaystyle\sum\limits} \)
\( \newcommand{\dint}{\displaystyle\int\limits} \)
\( \newcommand{\dlim}{\displaystyle\lim\limits} \)
\( \newcommand{\id}{\mathrm{id}}\) \( \newcommand{\Span}{\mathrm{span}}\)
( \newcommand{\kernel}{\mathrm{null}\,}\) \( \newcommand{\range}{\mathrm{range}\,}\)
\( \newcommand{\RealPart}{\mathrm{Re}}\) \( \newcommand{\ImaginaryPart}{\mathrm{Im}}\)
\( \newcommand{\Argument}{\mathrm{Arg}}\) \( \newcommand{\norm}[1]{\| #1 \|}\)
\( \newcommand{\inner}[2]{\langle #1, #2 \rangle}\)
\( \newcommand{\Span}{\mathrm{span}}\)
\( \newcommand{\id}{\mathrm{id}}\)
\( \newcommand{\Span}{\mathrm{span}}\)
\( \newcommand{\kernel}{\mathrm{null}\,}\)
\( \newcommand{\range}{\mathrm{range}\,}\)
\( \newcommand{\RealPart}{\mathrm{Re}}\)
\( \newcommand{\ImaginaryPart}{\mathrm{Im}}\)
\( \newcommand{\Argument}{\mathrm{Arg}}\)
\( \newcommand{\norm}[1]{\| #1 \|}\)
\( \newcommand{\inner}[2]{\langle #1, #2 \rangle}\)
\( \newcommand{\Span}{\mathrm{span}}\) \( \newcommand{\AA}{\unicode[.8,0]{x212B}}\)
\( \newcommand{\vectorA}[1]{\vec{#1}} % arrow\)
\( \newcommand{\vectorAt}[1]{\vec{\text{#1}}} % arrow\)
\( \newcommand{\vectorB}[1]{\overset { \scriptstyle \rightharpoonup} {\mathbf{#1}} } \)
\( \newcommand{\vectorC}[1]{\textbf{#1}} \)
\( \newcommand{\vectorD}[1]{\overrightarrow{#1}} \)
\( \newcommand{\vectorDt}[1]{\overrightarrow{\text{#1}}} \)
\( \newcommand{\vectE}[1]{\overset{-\!-\!\rightharpoonup}{\vphantom{a}\smash{\mathbf {#1}}}} \)
\( \newcommand{\vecs}[1]{\overset { \scriptstyle \rightharpoonup} {\mathbf{#1}} } \)
\(\newcommand{\longvect}{\overrightarrow}\)
\( \newcommand{\vecd}[1]{\overset{-\!-\!\rightharpoonup}{\vphantom{a}\smash {#1}}} \)
\(\newcommand{\avec}{\mathbf a}\) \(\newcommand{\bvec}{\mathbf b}\) \(\newcommand{\cvec}{\mathbf c}\) \(\newcommand{\dvec}{\mathbf d}\) \(\newcommand{\dtil}{\widetilde{\mathbf d}}\) \(\newcommand{\evec}{\mathbf e}\) \(\newcommand{\fvec}{\mathbf f}\) \(\newcommand{\nvec}{\mathbf n}\) \(\newcommand{\pvec}{\mathbf p}\) \(\newcommand{\qvec}{\mathbf q}\) \(\newcommand{\svec}{\mathbf s}\) \(\newcommand{\tvec}{\mathbf t}\) \(\newcommand{\uvec}{\mathbf u}\) \(\newcommand{\vvec}{\mathbf v}\) \(\newcommand{\wvec}{\mathbf w}\) \(\newcommand{\xvec}{\mathbf x}\) \(\newcommand{\yvec}{\mathbf y}\) \(\newcommand{\zvec}{\mathbf z}\) \(\newcommand{\rvec}{\mathbf r}\) \(\newcommand{\mvec}{\mathbf m}\) \(\newcommand{\zerovec}{\mathbf 0}\) \(\newcommand{\onevec}{\mathbf 1}\) \(\newcommand{\real}{\mathbb R}\) \(\newcommand{\twovec}[2]{\left[\begin{array}{r}#1 \\ #2 \end{array}\right]}\) \(\newcommand{\ctwovec}[2]{\left[\begin{array}{c}#1 \\ #2 \end{array}\right]}\) \(\newcommand{\threevec}[3]{\left[\begin{array}{r}#1 \\ #2 \\ #3 \end{array}\right]}\) \(\newcommand{\cthreevec}[3]{\left[\begin{array}{c}#1 \\ #2 \\ #3 \end{array}\right]}\) \(\newcommand{\fourvec}[4]{\left[\begin{array}{r}#1 \\ #2 \\ #3 \\ #4 \end{array}\right]}\) \(\newcommand{\cfourvec}[4]{\left[\begin{array}{c}#1 \\ #2 \\ #3 \\ #4 \end{array}\right]}\) \(\newcommand{\fivevec}[5]{\left[\begin{array}{r}#1 \\ #2 \\ #3 \\ #4 \\ #5 \\ \end{array}\right]}\) \(\newcommand{\cfivevec}[5]{\left[\begin{array}{c}#1 \\ #2 \\ #3 \\ #4 \\ #5 \\ \end{array}\right]}\) \(\newcommand{\mattwo}[4]{\left[\begin{array}{rr}#1 \amp #2 \\ #3 \amp #4 \\ \end{array}\right]}\) \(\newcommand{\laspan}[1]{\text{Span}\{#1\}}\) \(\newcommand{\bcal}{\cal B}\) \(\newcommand{\ccal}{\cal C}\) \(\newcommand{\scal}{\cal S}\) \(\newcommand{\wcal}{\cal W}\) \(\newcommand{\ecal}{\cal E}\) \(\newcommand{\coords}[2]{\left\{#1\right\}_{#2}}\) \(\newcommand{\gray}[1]{\color{gray}{#1}}\) \(\newcommand{\lgray}[1]{\color{lightgray}{#1}}\) \(\newcommand{\rank}{\operatorname{rank}}\) \(\newcommand{\row}{\text{Row}}\) \(\newcommand{\col}{\text{Col}}\) \(\renewcommand{\row}{\text{Row}}\) \(\newcommand{\nul}{\text{Nul}}\) \(\newcommand{\var}{\text{Var}}\) \(\newcommand{\corr}{\text{corr}}\) \(\newcommand{\len}[1]{\left|#1\right|}\) \(\newcommand{\bbar}{\overline{\bvec}}\) \(\newcommand{\bhat}{\widehat{\bvec}}\) \(\newcommand{\bperp}{\bvec^\perp}\) \(\newcommand{\xhat}{\widehat{\xvec}}\) \(\newcommand{\vhat}{\widehat{\vvec}}\) \(\newcommand{\uhat}{\widehat{\uvec}}\) \(\newcommand{\what}{\widehat{\wvec}}\) \(\newcommand{\Sighat}{\widehat{\Sigma}}\) \(\newcommand{\lt}{<}\) \(\newcommand{\gt}{>}\) \(\newcommand{\amp}{&}\) \(\definecolor{fillinmathshade}{gray}{0.9}\)Learning Objectives
Reports
- Written by Joe Moxley
- Category: Memos, Proposals & Reports
- Published: 21 December 2012
- Last Updated: 23 January 2018
Learning Objectives
- Discuss the main parts of a report.
- Understand the different types of reports.
- Write a basic report.
What Is a Report?
Reports are documents designed to record and convey information to the reader. Reports are part of any business or organization; from credit reports to police reports, they serve to document specific information for specific audiences, goals, or functions. The type of report is often identified by its primary purpose or function, as in an accident report, a laboratory report, a sales report, or even a book report. Reports are often analytical, or involve the rational analysis of information. Sometimes they simply “report the facts” with no analysis at all, but still need to communicate the information in a clear and concise format. Other reports summarize past events, present current data, and forecast future trends. While a report may have conclusions, propositions, or even a call to action, the demonstration of the analysis is the primary function. A sales report, for example, is not designed to make an individual sale. It is, however, supposed to report sales to date, and may forecast future sales based on previous trends. This chapter is designed to introduce you to the basics of report writing.
Types of Reports
Reports come in all sizes, but are typically longer than a page and somewhat shorter than a book. The type of report depends on its function. The function of the report is its essential purpose, often indicated in the thesis or purpose statement. The function will also influence the types of visual content or visual aids, representing words, numbers, and their relationships to the central purpose in graphic, representational ways that are easy for the reader to understand. The function may also contribute to parameters like report length (page or word count) or word choice and readability. “Focusing on the content of your longer business documents is not only natural but necessary because doing so helps ensure complete, correct information.” [1]
Reports vary by function, and they also vary by style and tradition. Within your organization, there may be employer-specific expectations that need to be addressed to meet audience expectations. This chapter discusses reports in general terms, focusing on common elements and points of distinction, but reference to similar documents where you work or additional examination of specific sample reports may serve you well as you prepare your own report.
Informational or Analytical Report?
There are two main categories for reports, regardless of their specific function or type. An informational report informs or instructs and presents details of events, activities, individuals, or conditions without analysis. An example of this type of “just the facts” report is a police accident report. The report will note the time, date, place, contributing factors like weather, and identification information for the drivers involved in an automobile accident. It does not establish fault or include judgmental statements. You should not see “Driver was falling down drunk” in a police accident report. Instead, you would see “Driver failed sobriety tests and breathalyzer test and was transported to the station for a blood sample.” The police officer is not a trained medical doctor and is therefore not licensed to make definitive diagnoses, but can collect and present relevant information that may contribute to that diagnosis.
The second type of report is called an analytical report. An analytical report presents information with a comprehensive analysis to solve problems, demonstrate relationships, or make recommendations. An example of this report may be a field report by a Center for Disease Control (CDC) physician from the site of an outbreak of the H1N1 virus, noting symptoms, disease progression, steps taken to arrest the spread of the disease, and to make recommendations on the treatment and quarantine of subjects.
Table 7 “Types of Reports and Their Functions” includes common reports that, depending on the audience needs, may be informational or analytical.
Table 7 Types of Reports and Their Functions
| Type | Function |
| 1. Laboratory Report | Communicate the procedures and results of laboratory activities |
| 2. Research Report | Study problems scientifically by developing hypotheses, collecting data, analyzing data, and indicating findings or conclusions |
| 3. Field Study Report | Describe one-time events, such as trips, conferences, seminars, as well as reports from branch offices, industrial and manufacturing plants |
| 4. Progress Report | Monitor and control production, sales, shipping, service, or related business process |
| 5. Technical Report | Communication process and product from a technical perspective |
| 6. Financial Report | Communication status and trends from a finance perspective |
| 7. Case Study | Represent, analyze, and present lessons learned from a specific case or example |
| 8. Needs Assessment Report | Assess the need for a service or product |
| 9. Comparative Advantage Report | Discuss competing products or services with an analysis of relative advantages and disadvantages |
| 10. Feasibility Study | Analyze problems and predict whether current solutions or alternatives will be practical, advisable, or produced the desired outcome(s) |
| 11. Instruction Manuals | Communicate step-by-step instructions on the use of a product or service |
| 12. Compliance Report | Document and indicate the extent to which a product or service is within established compliance parameters or standards |
| 13. Cost-Benefit Analysis Report | Communicate costs and benefits of products or services. |
| 14. Decision Report | Make recommendations to management and become tools to solve problems and make decisions |
| 15. Benchmark Report | Establish criteria and evaluate alternatives by measuring against the establish benchmark criteria |
| 16. Examination Report | Report or record data obtained from an examination of an item or conditions, including accidents and natural disasters |
| 17. Physical Description report | Describe the physical characteristics of a machine, a device, or object |
| 18. Literature Review | Present summaries of the information available on a given subject |
How Are Reports Organized?
Reports vary by size, format, and function. You need to be flexible and adjust to the needs of the audience while respecting customs and guidelines. Reports are typically organized around six key elements:
- Whom the report is about and/or prepared for
- What was done, what problems were addressed, and the results, including conclusions and/or recommendations
- Where the subject studied occurred
- When the subject studied occurred
- Why the report was written (function), including under what authority, for what reason, or by whose request
- How the subject operated, functioned, or was used
Pay attention to these essential elements when you consider your stakeholders, or those who have an interest in the report. That may include the person(s) the report is about, whom it is for, and the larger audience of the business, organization, or industry. Ask yourself who the key decision makers are who will read your report, who the experts or technicians will be, and how executives and workers may interpret your words and images. While there is no universal format for a report, there is a common order to the information. Each element supports the main purpose or function in its own way, playing an important role in the representation and transmission of information.
Here is a checklist for ensuring that a report fulfills its goals.
- Report considers the audience’s needs
- Format follows function of report
- Format reflects institutional norms and expectations
- Information is accurate, complete, and documented
- Information is easy to read
- Terms are clearly defined
- Figures, tables, and art support written content
- Figures, tables, and art are clear and correctly labeled
- Figures, tables, and art are easily understood without text support
- Words are easy to read (font, arrangement, organization)
- Results are clear and concise
- Recommendations are reasonable and well-supported
- Report represents your best effort
Exercises
- Find an annual report for a business you would like to learn more about. Review it with the previous reading in mind and provide examples. Share and compare with classmates.
- Write a report on a trend in business that you’ve observed, and highlight at least the main finding. For example, from the rising cost of textbooks to the Flat World Knowledge approach to course content, textbooks are a significant issue for students. Draw from your experience as you bring together sources of information to illustrate a trend. Share and compare with classmates.
References
[1] Bovee, C., & Thill, J. (2010). Business communication essentials: A skills-based approach to vital business English (4th ed.). Upper Saddle River, NJ: Prentice Hall.
Learning Objectives
Front Matter Components
- Written by Angela Eward Mangione and Katherine McGee
- Category: Memos, Proposals & Reports
- Published: 28 June 2013
- Last Updated: 23 January 2018
You may wish to review:
Title Page
The title page provides the audience with the:
- Name of the report
- This should appear 2 inches from the top margin in uppercase letters.
- Name, title, and organization of the individual receiving the report
- Type “Prepared for” on one line, followed by two separate lines that provide the receiving organization’s name and then the city and state. Some reports may include an additional line that presents the name of a specific person.
- Name of the author and any necessary identifying information
- Type “prepared by” on one line, followed by the name(s) of the author(s) and their organization, all on separate lines.
- Date of submission
- This date may differ from the date the report was written. It should appear 2 inches above the bottom margin.
The items on the title page should be equally spaced apart from each other.
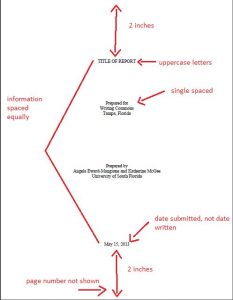
Figure 18 Title page example
A note on page numbers:
The title page should not include a page number, but this page is counted as page “i.” Use software features to create two sections for your report. You can then utilize two different types of numbering schemes. When numbering the pages (i.e., i, ii, iii, etc.) for a formal report, use lowercase roman numerals for all front matter components. Utilize arabic numbers for the other pages that follow. Additionally, if you intend to bind the report on the left, move the left margin and center 0.25 inches to the right.
A note on font:
If there is no specific preference for serif vs. sans serif font, choose one and use it consistently throughout the report. Do not utilize anything besides a traditional serif (e.g., Times New Roman) or sans serif (e.g., Arial or Calibri) font.
Letter of Transmittal
A letter of transmittal announces the report topic to the recipient(s).
If applicable, the first paragraph should identify who authorized the report and why the report is significant. Provide the purpose of the report in the first paragraph as well. The next paragraph should briefly identify, categorize, and describe the primary and secondary research of the report. Use the concluding paragraph to offer to discuss the report; it is also customary to conclude by thanking the reader for their time and consideration.
The letter of transmittal should be formatted as a business letter. Some report writers prefer to send a memo of transmittal instead.
When considering your audience for the letter or memo of transmittal, make sure that you use a level of formality appropriate for your relationship with the reader. While all letters should contain professional and respectful language, a letter to someone you do not know should pay closer attention to the formality of the word choice and tone.
Table of Contents
The table of contents page features the headings and secondary headings of the report and their page numbers, enabling audience members to quickly locate specific parts of the report. Leaders (i.e. spaced or unspaced dots) are used to guide the reader’s eye from the headings to their page numbers.
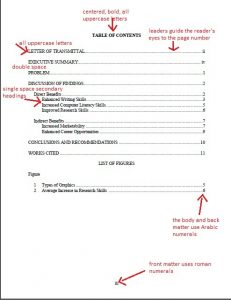
Figure 19 Table of Contents example
The words “TABLE OF CONTENTS” should appear at the top of the page in all uppercase and bolded letters. Type the titles of major report parts in all uppercase letters as well, double spacing between them. Secondary headings should be indented and single spaced, using a combination of upper- and lowercase letters.
Executive Summary
An executive summary presents an overview of the report that can be used as a time-saving device by recipients who do not have time to read the entire report.
The executive summary should include a:
- Summary of purpose
- Overview of key findings
- Identification of conclusions
- Overview of recommendations
To begin, type “EXECUTIVE SUMMARY” in all uppercase letters and centered. Follow this functional head with paragraphs that include the above information, but do not use first-level headings to separate each item. Each paragraph of information should be single-spaced with double spacing between paragraphs. Everything except for the title should be left-aligned.
An executive summary is usually ten percent of the length of the report. For example, a ten-page report should offer a one-page summary. A 100-page report should feature a summary that is approximately ten pages.
Learning Objectives
Body of Report
- Written by Angela Eward Mangione and Katherine McGee
- Category: Memos, Proposals & Reports
- Published: 28 June 2013
- Last Updated: 23 January 2018
You may wish to review:
Introduction
The body of a formal report begins with an introduction. The introduction sets the stage for the report, clarifies what need(s) motivated it, and orients the reader to its structure.
Most report introductions address the following elements: background information, problem or purpose, significance, scope, methods, organization, and sources. As you may have noticed, some parts of a formal report fulfill similar purposes. Information from the letter of transmittal and the executive summary may be repeated in the introduction. Reword the information in order to avoid sounding repetitive.
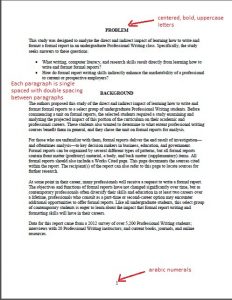
Figure 20 Report body
To begin this section, type “BACKGROUND” or “INTRODUCTION” in all uppercase letters. This functional head should be followed by the information specified above (i.e., background information, problem or purpose, etc.). You do not need to utilize any first-level headings in this section.
Because this section includes background information, it would be the appropriate place to address the needs of audiences that may need additional knowledge about the topic. Provide definitions of technical terms and instruction about the overall project if necessary. If you are uncertain if your audience needs a particular piece of information, go ahead and include it; it’s better to give your reader a little bit too much background than not enough.
Discussion of Findings
The Discussion of Findings section presents the evidence for your conclusions.
This key section should be carefully organized to enhance readability.
To begin, type “DISCUSSION OF FINDINGS” in all uppercase letters. Center this and all other functional heads. Follow “DISCUSSION OF FINDINGS” with a brief paragraph that previews the organization of the report.
Useful organizational patterns for report findings include but are not limited to:
- Best Case/Worst Case
- Compare/Contrast
- Chronology
- Geography
- Importance
- Journalism Pattern
Use a Best Case/Worst Case organizational pattern when you think that the audience may lack interest in the topic. When examining a topic with clear alternatives to your proposed solution, consider using a Compare/Contrast pattern. Geographical patterns work effectively for topics that are discussed by location.
When describing the organization of the report in the first paragraph, broadly identify how the material in the report is organized rather than state that the report uses a specific pattern (e.g. Chronology, Geography). For example, write, “The research findings address curriculum trends in three states: (a) Florida, (b) Georgia, and (c) North Carolina,” not, “This report uses a geographical organizational pattern.”
Follow the first paragraph with a first-level heading. Use first-level headings for all other major parts of this section. First-level headings should appear in bold, uppercase letters. Center first-level headings, but align any second-level headings with the left margin. Type any second-level headings in bold, upper- and lowercase letters.
As you present, interpret, and analyze evidence, consider using both text and graphics. Take into account what will be easiest for your audience to understand.
Include citations for all quoted or paraphrased material from sources as well; check with your organization as to whether they prefer parenthetical citations or footnotes.
Integrating Graphics
Formal report authors use graphics to present data in different forms. Paragraphs of text and complex or numerical data tend to bog readers down, making graphics a beneficial enhancement. Graphics also make data easier to understand, so they sometimes make a stronger impact on the audience.
Knowing when—and how—to effectively employ graphics is the key to successfully integrating them. Keeping the audience in mind is also critical.
Figure 19 summarizes uses and audience benefits for the most frequently employed types of graphics. The types of graphics are presented alphabetically to make them easier to remember.
| GRAPHIC
Graphic Type |
USE
This type . . . |
BENEFITS
The audience can . . . |
| Bar Chart | Represents data with the height or length of rectangular bars | Compare items
Grasp a series of numbers |
| Flowchart | Illustrates a sequence of events with shapes connected by arrows | Grasp a series of steps |
| Line Chart | Shows changes in quantitative data over time or plots the relationship between two variables with one or more lines | Compare variables
Visualize change over time |
| Map | Illustrates activities or trends on a map that represents geographically organized parts of a region, country, or the world | Compare geographical trends
Grasp geographical relationships |
| Pie Chart | Depicts distribution of parts in a whole with wedges in a circle graph | Compare significance of parts and parts-to-whole relationship(s) |
| Table | Presents data or values in rows and columns | Compare data or values
Grasp relationships between data or values |
Figure 21 Types of graphics
Computers have made it easier for professionals to create effective graphics. Most of the graphics in Figure 19 can be created in Microsoft Office Word and Excel.
There may also be some occasions in which a formal report includes graphics from a particular print or online source. In these instances, it is critical to include a caption that presents the source of the graphic.
Learning Objectives
Back Matter Components
- Written by Angela Eward Mangione and Katherine McGee
- Category: Memos, Proposals & Reports
- Published: 28 June 2013
- Last Updated: 23 January 2018
You may wish to review:
Conclusions and Recommendations
The conclusions and recommendations section conveys the key results from the analysis in the discussion of findings section. Up to this point, readers have carefully reviewed the data in the report; they are now logically prepared to read the report’s conclusions and recommendations.
Type “CONCLUSIONS AND RECOMMENDATIONS” in all uppercase letters. Follow this functional head with the conclusions of the report. The conclusions should answer any research questions that were posed earlier in the report. Present the conclusions in an enumerated or bulleted list to enhance readability.
Recommendations offer a course of action, and they should answer any problem or research questions as well. Think back to the expectations of your audience. Have all of their requirements been addressed?
Works Cited
All formal reports should include a works cited page; his page documents the sources cited within the report. The recipient(s) of the report can also refer to this page to locate sources for further research.
It is acceptable to follow MLA (Modern Language Association), CMS (Chicago Manual of Style), or APA (American Psychological Association) documentation style for entries on this page. Arrange all sources alphabetically. Refer to the latest edition of the appropriate style handbook for more information about how to format entries for print and electronic sources on the Works Cited page
Conclusion
While some of the formatting rules may seem tedious at first, they are necessary in order for your audience to better understand the report. Using a regulated format allows for a more universal organization that everyone will understand. Being aware of your audience’s needs and expectations will allow for a strong report that will satisfy your employee and demonstrate your competence in your field.
Functions and Contents of Progress Reports
In the progress report, you explain any or all of the following:
- How much of the work is complete
- What part of the work is currently in progress
- What work remains to be done
- What problems or unexpected things, if any, have arisen
- How the project is going in general
Progress reports have several important functions:
- Reassure recipients that you are making progress, that the project is going smoothly, and that it will be complete by the expected date.
- Provide recipients with a brief look at some of the findings or some of the work of the project.
- Give recipients a chance to evaluate your work on the project and to request changes.
- Give you a chance to discuss problems in the project and thus to forewarn recipients.
- Force you to establish a work schedule so that you’ll complete the project on time.
- Project a sense of professionalism to your work and your organization.
This chapter was derived by Annemarie Hamlin, Chris Rubio, and Michele DeSilva, Central Oregon Community College, from Online Technical Writing by David McMurrey – CC: BY 4.0
Timing and Format of Progress Reports
In a year-long project, there are customarily three progress reports, one after three, six, and nine months. Depending on the size of the progress report, the length and importance of the project, and the recipient, the progress report can take the following forms:
- Memo—A short, informal report to someone within your organization
- Letter—A short, informal report sent to someone outside your organization
- Formal report—A formal report sent to someone outside your organization
In our course, you will write a progress report in the form of a thorough memo, and you will attach an outline to that memo to give your recipient an idea of the content in your final report. (See the chapter on Outlines for more information.)
This chapter was derived by Annemarie Hamlin, Chris Rubio, and Michele DeSilva, Central Oregon Community College, from Online Technical Writing by David McMurrey – CC: BY 4.0
Organizational Patterns or Sections for Progress Reports
The recipient of a progress report wants to see what you’ve accomplished on the project, what you are working on now, what you plan to work on next, and how the project is going in general. In other words, the following three sections are key in any progress memo or progress report:
- Work accomplished in the preceding period(s)
- Work currently being performed
- Work planned for the next period(s)
This chapter was derived by Annemarie Hamlin, Chris Rubio, and Michele DeSilva, Central Oregon Community College, from Online Technical Writing by David McMurrey – CC: BY 4.0
Other Parts of Progress Reports
In your progress memo or report, you also need to include the following sections: (a) an introduction that reviews the purpose and scope of the project, (b) a detailed description of your project and its history, and (c) an overall appraisal of the project to date, which usually acts as the conclusion.
- Opening paragraph introducing the purpose of the memo and a reminder about the project topic
- Summary of the project
- Specific objectives of the project
- Scope, or limits, of the project
- Research gathered
- Overall assessment or appraisal of the project at this time
References
This chapter was derived by Annemarie Hamlin, Chris Rubio, and Michele DeSilva, Central Oregon Community College, from Online Technical Writing by David McMurrey – CC: BY 4.0
Media Attributions
- Title Page
- Table of Contents
- Body

Chapter 7: Formal Reports by Joe Moxley; Angela Eward Mangione; and Katherine McGee is licensed under a Creative Commons Attribution-NonCommercial 4.0 International License, except where otherwise noted.