
9.2: Appendix B - Working With Multiple Tables
- Page ID
- 174511

Introduction
Historian and database designer Mark Merry observes:
Most databases consist of data held in more than one table, and this is especially true for databases where the data is derived from historical sources. Relationships are created between the tables to connect the data in one to the data in the other: more precisely, relationships are used to connect specific records in one table to specific records in another. In many ways relationships, and the whole relational data model, comprise the most difficult aspect of designing a database, and not necessarily because they are difficult to actually create. What is difficult about relationships is why we need them – the reasons for using related data can seem obscure and unnecessary at the start of a database project, especially if you have limited experience of using databases. They are, however, extremely important. In essence what relationships allow us to do is two-fold: firstly they allow us to simplify very significantly the process of data entry (and incidentally at the same time enable us to protect the quality of the data we enter by limiting data entry errors); and secondly they serve to ensure that the results of our queries are accurate by making it clear precisely what it is that is being queried.
Functions of Relationships
These dual functions of relationships are best illustrated with an example.
Imagine a database which contained data about people and the cars that they owned, comprising personal information about name, gender, date of birth and so on, as well as information about car type and the color of the car. There are two ways that this database could be designed:
A single (flat file) table data model, where all of the information about people and cars was entered into the same table
A relational data model where two tables are created, one to contain information about people, and one to contain information about cars
The two scenarios are both feasible and will allow you to conduct a detailed analysis of people and their hats, but each brings with them some very significant consequences if chosen.
Scenario A: all information in one table
In this scenario you have a table with various fields to capture all of the people- and car-related information available from your sources: Database design principles say that you should not combine different entities into a single table (in this case ‘people’ and ‘cars’ being the entities), as this confuses the underlying ‘meaning’ of your data. Good practice would say: car owners are one entity, cars are another, so create different tables for them. However, it is possible to combine entities into single tables, and for our purposes here it is useful to see the consequences of doing so.
|
PersonID |
FirstName |
LastName |
DoB |
DoD |
Race |
Location |
Gender |
CarID |
CarType |
CarMake |
CarModel |
CarColor |
Entering a number of records into this table would result in data that resembled:
|
PersonID |
FirstName |
LastName |
DoB |
DoD |
Race |
Location |
Gender |
CarID |
CarType |
CarMake |
CarModel |
CarColor |
|
|
1 |
Anthony |
Soprano |
1/22/1958 |
11/15/2003 |
White |
New Jersy |
Male |
1 |
Sedan |
Honda |
Accord |
Black |
|
|
2 |
John |
Snow |
2/15/1998 |
White |
Winterfell |
Male |
2 |
Coupe |
Honda |
Civic |
Red |
||
|
3 |
Scarlett |
O’Hara |
5/16/1842 |
3/10/1931 |
White |
Tara |
Female |
3 |
SUV |
Nissan |
Rogue |
White |
|
|
4 |
Sherlock |
Holmes |
6/29/1859 |
4/4/1940 |
White |
London |
Male |
4 |
SUV |
Cadillac |
Esplanade |
Silver |
|
|
5 |
George |
Jefferson |
1/1/1956 |
12/20/2004 |
Black |
New York |
Male |
4 |
SUV |
Cadillac |
Esplanade |
Silver |
|
|
6 |
Louise |
Jefferson |
3/3/1960 |
10/8/2010 |
Black |
New York |
Female |
5 |
SUV |
Ford |
Escape |
Blue |
|
|
7 |
Laverne |
Cox |
7/5/1981 |
Black |
New Jersey |
6 |
Convertible |
Volkswagen |
Golf |
Gold |
|||
|
8 |
Lucille |
Ricardo |
9/19/1930 |
1/5/2004 |
White |
New York |
Female |
7 |
Sedan |
Pontiac |
Bonneville |
Aqua |
|
|
9 |
Ricky |
Ricardo |
10/1/1926 |
1/20/1989 |
Hispanic |
Cuba |
Male |
7 |
Sedan |
Pontiac |
Bonneville |
Aqua |
|
|
10 |
Fred |
Mertz |
11/1/1905 |
1/2/1975 |
White |
NYC |
Male |
||||||
|
11 |
Ethel |
Mertz |
11/5/1912 |
6/30/1990 |
White |
New York City |
Female |
||||||
With a table like this we would be able to perform some sophisticated analysis on types of people, types of car, make, model, materials used, the correlation between gender, age and car type, gender distribution of car colors and so on, which would obviously be of enormous benefit to historians interested in this kind of research.
As we continue to examine our sources, we find that some people own more than one car. Some cars are owned by more than one person. This is a one-to-many relationship: one person may have more than one car. So, in this database design scenario we might find records appearing in the table in the following manner:
|
PersonID |
FirstName |
LastName |
DoB |
DoD |
Race |
Location |
Gender |
CarID |
CarType |
CarMake |
CarModel |
CarColor |
|
1 |
Anthony |
Soprano |
1/22/1958 |
11/15/2003 |
White |
New Jersy |
Male |
1 |
Sedan |
Honda |
Accord |
Black |
|
2 |
John |
Snow |
2/15/1998 |
White |
Winterfell |
Male |
2 |
Coupe |
Honda |
Civic |
Red |
|
|
3 |
Scarlett |
O’Hara |
5/16/1842 |
3/10/1931 |
White |
Tara |
Female |
3 |
SUV |
Nissan |
Rogue |
White |
|
4 |
Sherlock |
Holmes |
6/29/1859 |
4/4/1940 |
White |
London |
Male |
4 |
SUV |
Cadillac |
Esplanade |
Silver |
|
5 |
George |
Jefferson |
1/1/1956 |
12/20/2004 |
Black |
New York |
Male |
4 |
SUV |
Cadillac |
Esplanade |
Silver |
|
6 |
Louise |
Jefferson |
3/3/1960 |
10/8/2010 |
Black |
New York |
Female |
5 |
SUV |
Ford |
Escape |
Blue |
|
7 |
Laverne |
Cox |
7/5/1981 |
Black |
New Jersey |
6 |
Convertible |
Volkswagen |
Golf |
Gold |
||
|
8 |
Lucille |
Ricardo |
9/19/1930 |
1/5/2004 |
White |
New York |
Female |
7 |
Sedan |
Pontiac |
Bonneville |
Aqua |
|
9 |
Ricky |
Ricardo |
10/1/1926 |
1/20/1989 |
Hispanic |
Cuba |
Male |
7 |
Sedan |
Pontiac |
Bonneville |
Aqua |
|
10 |
Fred |
Mertz |
11/1/1905 |
1/2/1975 |
White |
NYC |
Male |
|||||
|
11 |
Ethel |
Mertz |
11/5/1912 |
6/30/1990 |
White |
New York City |
Female |
|||||
|
12 |
Laverne |
Cox |
7/5/1981 |
Black |
New Jersey |
8 |
Sedan |
Ford |
Taurus |
Green |
As you can see the table now has 12 records rather than 11, and we have entered Lavern Cox twice (which created a new problem since there are two separate PersonID’s associated with her). The reason we have entered this twice is because Lavern Cox owns two cars, as you can see in the car-related fields. Some individuals own the same care. As a result, some of our fields have duplicated values in them, and this is both a problem, and a clue to the fact that this table might be better designed as part of a relational data model. Duplicating information across records in this way should be avoided for a number of reasons. Firstly, data entry is time consuming enough without having to enter the same information on more than one occasion. Secondly, the more times you enter the same piece of information into the database the more scope there is for entering something incorrectly, as we have done here with Anthony Soprano’s location value.
This particular error could have been avoided through the use of a variety of tools within the database that are designed to mitigate data entry errors.
But the most serious problem that this duplication of information raises is a third problem – which is that this will adversely affect some types of analysis by providing false results to queries. We could write a query to answer the question: ‘how many individuals own a car?’ The query count the number of records of people who owned cars this would be the answer to the question. The query would indicate that there were 10 people who owned cars. But in fact, there are only nine separate individuals who own a car. Laverne is counted twice for owning two cars when she should only have been counted once.
Scenario B: two related tables
So, what happens if we model the person and car information in line with the good practice of having a separate table for each entity? We would end up with two tables:
Person table:
|
PersonID |
FirstName |
LastName |
DoB |
DoD |
Race |
Location |
Gender |
|
1 |
Anthony |
Soprano |
1/22/1958 |
11/15/2003 |
White |
New Jersy |
Male |
|
2 |
John |
Snow |
2/15/1998 |
White |
Winterfell |
Male |
|
|
3 |
Scarlett |
O’Hara |
5/16/1842 |
3/10/1931 |
White |
Tara |
Female |
|
4 |
Sherlock |
Holmes |
6/29/1859 |
4/4/1940 |
White |
London |
Male |
|
5 |
George |
Jefferson |
1/1/1956 |
12/20/2004 |
Black |
New York |
Male |
|
6 |
Louise |
Jefferson |
3/3/1960 |
10/8/2010 |
Black |
New York |
Female |
|
7 |
Laverne |
Cox |
7/5/1981 |
Black |
New Jersey |
||
|
8 |
Lucille |
Ricardo |
9/19/1930 |
1/5/2004 |
White |
New York |
Female |
|
9 |
Ricky |
Ricardo |
10/1/1926 |
1/20/1989 |
Hispanic |
Cuba |
Male |
|
10 |
Fred |
Mertz |
11/1/1905 |
1/2/1975 |
White |
NYC |
Male |
|
11 |
Ethel |
Mertz |
11/5/1912 |
6/30/1990 |
White |
New York City |
Female |
Car table:
|
PersonID |
CarID |
CarType |
CarMake |
CarModel |
CarColor |
|
1 |
1 |
Sedan |
Honda |
Accord |
Black |
|
2 |
2 |
Coupe |
Honda |
Civic |
Red |
|
3 |
3 |
SUV |
Nissan |
Rogue |
White |
|
4 |
4 |
SUV |
Cadillac |
Esplanade |
Silver |
|
5 |
4 |
SUV |
Cadillac |
Esplanade |
Silver |
|
6 |
5 |
SUV |
Ford |
Escape |
Blue |
|
7 |
6 |
Convertible |
Volkswagen |
Golf |
Gold |
|
7 |
8 |
Sedan |
Ford |
Taurus |
Green |
|
8 |
7 |
Sedan |
Pontiac |
Bonneville |
Aqua |
|
9 |
7 |
Sedan |
Pontiac |
Bonneville |
Aqua |
Entering the two sets of information into the two separate tables allows us to avoid all of the problems mentioned above, and crucially, will allow us to run our queries safe in the knowledge that the correct number of records will be returned every time.
Tables are related by a relationship which connects one or more fields in one table with one or more field in the second table. In our People and Cars tables, the field used in the relationship is the PersonID field, where the ID number of the person is added to the record in the Cats table for those cars belonging to that person (so person number 7, Laverne Cox, has her ID number associated with the records of the two cars that she owns.
Types of Relationships
It is important to understand that there are different kinds of relationship that can exist between two tables. These differences are a function of the logical, semantic connection between the information between the two tables.

The three types of relationships
There are three types of relationship that can exist between two tables in a database, not all of which are useful or desirable.
One-to-one relationships:
This relationship exists where a record in Table A can only have one related record in Table B, and a record in Table B can only have a single matching record in Table A
For example, a state can have only one capital city, and a capital city is only in one state.
This type of relationship is unusual in a database. Usually either the information is combined in one table, or it is determined that some of that information is not necessary to record. The important thing to remember with one-to-one relationships is that the database software that you use to build your database will allow you to create this kind of relationship, and that it will not create any problems when it comes to running queries.
One-to-many relationships:
This relationship exists where a record in Table A can have none, one, or more matching records in Table B, but a record in Table B can only have one matching records in Table A.
For example, a mother can have more than one child, but a child can have only one biological mother
This is the most common type of relationship in found in databases, and is usually the type that you want to build into your designs. As illustrated in the people and cars scenario this type of relationship is used to overcome the kinds of problems that arise within the database when the information drawn from the sources would require the duplication of data if entered into a single table.
Many-to-many relationships:
This relationship exists where a record in Table A can have none, one, or many matching records in Table B, and a record in Table B can have none, one, or more than one matching records in Table A
For example, an author can write more than one book and a book can be written by more than one author.
If you discover this kind of relationship within your database design, then you have a challenge which will need to be addressed before you can proceed to actually building the database. Many-to-many relationships are difficult to control and they can easily break a query and return gibberish or nothing at all. Considerable skill and effort are required to manage many-to-many relationships. These should be avoided when possible.
Unfortunately we frequently see many-to-many relationships appear when modelling historical information. Dealing with a many-to-many relationship requires requires the creation of a table, sometimes called a Junction Table, to sit between the two related tables. This Junction Table will act in an abstract fashion – the data it will contain will not be information as such, but they will serve to separate the many-to-many relationship into two one-to-many relationships.
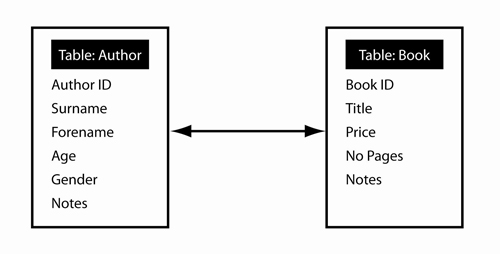
Many-to-many relationship between Author and Book tables
Take the database which contains a table about Authors and a table about Books, which might be designed according to the Entity Relationship Diagram shown above. This is a many-to-many relationship. An author can write multiple books. A book can have multiple authors. To overcome the many-to-many relationship, we would insert a Junction Table to spit the relationship into two one-to-many relationships, as indicated below.
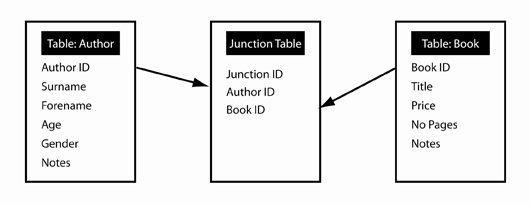
Many-to-many relationship between Author and Book tables split with a Junction Table
Note that each record in the Junction Table contains three fields: a unique ID for each record (Junction ID), and then a field for each of the Author IDs and Book IDs. Each record therefore becomes a unique combination of Author and Book IDs, which indicates which books were written by which authors:
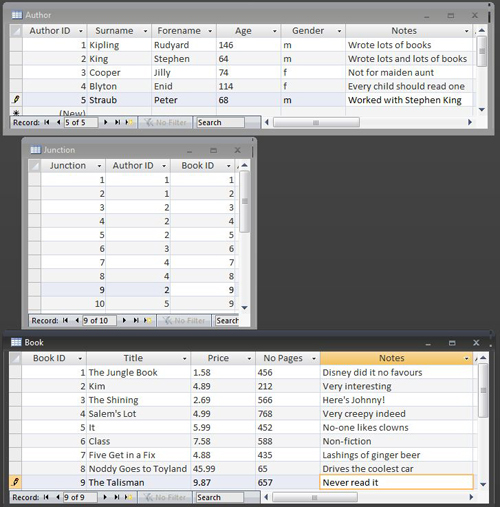
Many-to-many relationship between Author and Book tables split with a Junction Table – showing data
The Junction Table here is effectively circumventing the many-to-many relationship between books and authors, and each record it contains acts as a statement linking one or more author with one or more books. The first two records in the Junction Table, for example indicate that Author ID 1 was the writer of Book IDs 1 and 2, whilst the last two records indicate that Book ID 9 was co-authored by Author IDs 2 and 5. The relationship between books and authors is managed by the Junction Table, whilst the details about books and authors are kept in their respective tables.
This arrangement enables the database to run queries that draw on information in both the Book and Author tables when it would otherwise not be able to due to the many-to-many relationship. It is therefore a very valuable technique to bear in mind when identifying relationships between tables as part of the database design process.
Entity relationship modeling
Introduction
This section describes the tasks involved in performing translating and converting information from sources into data. These processes are collectively known as Entity Relationship Modelling (ERM). ERM is a complex activity, and one that can be challenging at first. Fortunately, however, the stages of ERM draw closely upon the skills and experience that an historian uses as a matter of course during research. The difficulty of the ERM process is directly proportional to the complexity of the source(s) being used in the research, with some types of sources being (relatively) simpler to model than others. Highly structured sources like census returns, lists of inhabitants, poll books and so on will be easier to model than ‘semi-structured’ sources such as probate inventories, which in turn will present fewer problems than completely unstructured material such as narrative texts and interviews, and so on. However, all will have their own particular features and problems to complicate the modelling.
The ERM process produces several results. It causes you to decide what the database is to achieve in terms of functions. It identifies the types of information that can be obtained from the sources. Along with solidifying the aim of the database, this helps you decide which information from the sources should be entered and which can be omitted. ERM causes you to consider in detail about the components of the database – tables, fields, relationships, datatypes, etc. Last, ERM promotes reflection on the layers of the database, such as what information needs to be in the source layer and should be in the standardization layer. The ERM process leaves you with a clear idea of what the database will look like as well as providing a working diagram of the database (an Entity Relationship Diagram [ERD]).
Entity relationship modeling (ERM)
Stage 1: Determine the purpose of the database
This stage is always the starting point of the ERM process; it is particularly vital if you are using the Method-oriented approach to your design. At this point you should decide what information you want to keep and what you want to discard; you will need to be prepared to abide by the consequences of these choices throughout the lifecycle of your database project. Although it is always theoretically possible to retrofit the design of your database to include information that you had initially decided to discard, it is rarely a trivial matter to do so, particularly if you have to enter another phase of data entry to collect the new information.
Stage 2: List entities
When you know what you want your database to do, divide your anticipated information into discrete subjects: each subject, or entity, will evolve into a separate table. Separate the entities into distinct tables for the purposes of efficiency, to avoid ambiguity, and because for maximum flexibility in querying.
This stage of the process sounds deceptively simple, but is in fact probably the most difficult step of the whole process. Do not be surprised if you have to do some of this more than once or make some significant revisions.
For example, consider a research project that was investigating political elections in eighteenth-century Bristol, and the sources consisted of a collection of poll books which recorded the votes cast by the local electorates in the communities where elections took place:
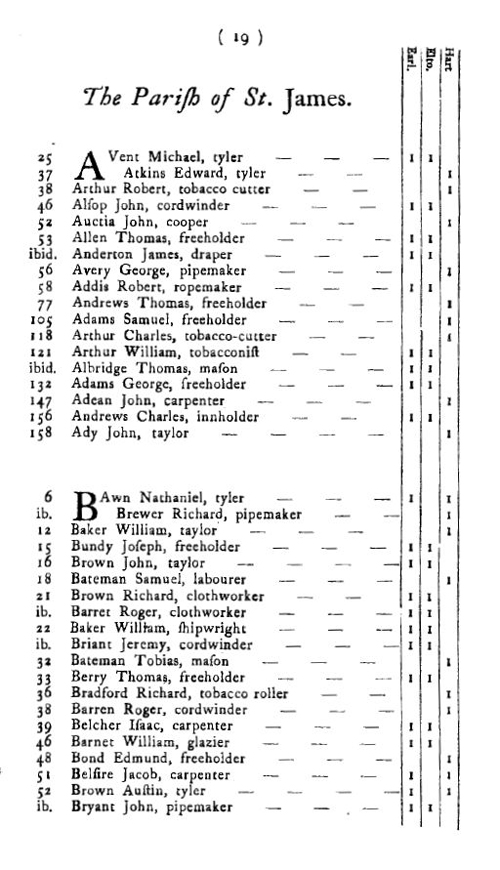
An Exact List of the Votes of the Freeholders and Freemen of the City and County of Bristol taken at the Election of Members of Parliament (Bristol, 1722) p.19.
With sources such as these we might pursue a research question which was something like: ‘Analyze the geographic and economic determinants of voting in early 18th century Bristol’. With a question like this we would be interested in geography, economic status and voting patterns in relation to a group of individuals. In terms of entities, we might conclude that there is only one: people, actually, more precisely, we would be considering voters, which would lead us to the position of deciding that we would need a table into which we would enter our information about voters.
However, if we were using probate materials for our research and wanted to create a database of information obtained from wills, we should consider the entities from this source. We might conceive of our entities – our discrete subjects or each table – as breaking down into ‘document’, with each will being treated as a different document; ‘person’, containing information about different types of people and their roles – testator, recipient, executor etc.; ‘bequest’ with a range of types of associated information; and ‘object’, being the object of a bequest. If our research was interested in the material culture of a period or place, this latter entity would be particularly important, whereas if the project was concerned only with networks of people and social interrelations, the ‘object’ entity might not be necessary.
It is perhaps worth considering the inclusion of three commonly chosen entities in the design of your database:
- People – with a related entity of ‘role’ (being the reason why they are present in the source)
- Document – where archival and bibliographical material can be entered (and thus enabling the tracking of every piece of data in the database to its source)
- Event – a slightly more abstract entity, one which describes an instance of whatever it is your source records (a trial, a taxation assessment, an election etc.) and where information about dates can be recorded.
Stage 3: Identify the relationships between the entities
Here you identify how your entities are related and what type of relationship exists between them. This requires some abstract thinking and will take some practice. It is typical that this stage will result in revisiting stage 2 and redefining one or more of the entities you originally chose.
If we returned to the database of wills mentioned in stage 2 with the entities ‘document’, ‘person’, ‘bequest’ and ‘object’, we would need to unpick the nature of the relationships between these entities. We might logically decide that the relationships would look something like this (the arrowheads depict the ‘many’ sides of a one-to-many relationship:

Example of relationships identified between entities (wills)
A single document (will) can contain information about more than one person and also about more than one bequest, whilst a bequest can include information about more than one object, so all of these relationships are one-to-many.
Stage 4: Investigate and rectify problems
This stage is fairly self-explanatory. It is possible to spot problems with the incipient design even at this relatively early point in the ERM process, and if they exist it is better to do so here than after investing work in the later stages.
Look out in particular for:
Relationships which do not appear to be one-to-many: remember you cannot have entities related by a many-to-many relationship, and while you can have them related through a one-to-one relationship, it may be worth rethinking the two entities involved.
Redundant relationships: if entities can be linked in more than one way, you should work out which link should be kept and which should be discarded – if Table A is related to Table B, and Table B is related to Table C, then Tables A and C are already by definition related, and do not need a ‘direct’ relationship to exist between the two
Stage 5: List all attributes associated with each entity, and identify keys
This stage involves listing the attributes of each entity that has been identified in the previous stages of the ERM process, by deciding on the fields that should occur in each table. Each field contains one piece of information about the subject of the entity. When you have identified the attributes for each entity, you then determine which field(s) will act as the primary and foreign keys in each table.
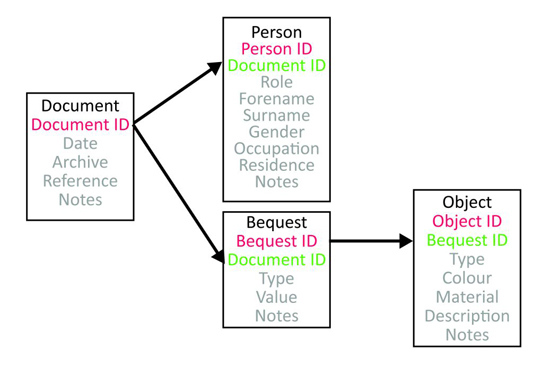
Example of attributes and keys identified within entities (wills)
Terms in black are entity (table names), those in red are primary keys, those in green are foreign keys and those in grey are the remaining attributes/fields, some of which pertain to the database’s Source layer, and some to its Standardization layer.
It is generally a good idea to include a generic ‘Notes’ field into most table, with the memo datatype. This is likely to prove life-saving at moments of crisis when entering data.
Stage 6: Construct the Entity Relationship Diagram (ERD)
Once you have completed stage 5, you are in a position to create the ERD for your database design, which will resemble the heavily simplified example above.