
2.4: Specialized Reading Strategies
- Page ID
- 5268

- Identify strategies for reading on digital devices
- Identify strategies for reading math, social science, and science texts
- Identify strategies for reading graphics (charts, etc.)
New technology offers us many more exciting ways to interact with reading content, whether it’s for work, school, or pleasure. It also changes the way that we understand what we read, when we move from printed pages to computer screens, as the following excerpt explains.
“HYPERLINKS”
Embedded hyperlinks in documents or Internet pages have been found to make different demands on the reader than traditional text. Authors, such as Nicholas Carr, and psychologists, such as Maryanne Wolf, contend that the internet may have a negative impact on attention and reading comprehension. Some studies report increased demands of reading hyperlinked text in terms of cognitive load, or the amount of information actively maintained in one’s mind (also see working memory). One study showed that going from about 5 hyperlinks per page to about 11 per page reduced college students’ understanding (assessed by multiple choice tests) of articles about alternative energy. This can be attributed to the decision-making process (deciding whether to click on it) required by each hyperlink, which may reduce comprehension of surrounding text.
On the other hand, other studies have shown that if a short summary of the link’s content is provided when the mouse pointer hovers over it, then comprehension of the text is improved. “Navigation hints” about which links are most relevant improved comprehension. Finally, the background knowledge of the reader can partially determine the effect hyperlinks have on comprehension. In a study of reading comprehension with subjects who were familiar or unfamiliar with art history, texts which were hyperlinked to one another hierarchically (in order of importance) were easier for novices to understand than texts which were hyperlinked semantically (in order of relationships between content). In contrast, those already familiar with the topic understood the content equally well with both types of organization.
This section will address best practices to adopt when reading particular kinds of sources, like math textbooks and online content.
Figure \(\PageIndex{1}\)
Online Reading Strategies
It’s more and more likely that you’ll have to do at least some of your reading for college online. Class readings, library resources, and even textbooks are going digital. Reading online is convenient, and often cheaper than accessing print versions. It can be quite a different experience to closely read and retain information from a screen, rather than a printed page, however.
You should practice some strategies that will improve your online reading comprehension and speed. And some of the tactics you learn about here will help you with any kind of reading you might do, not just the stuff that’s online.
Print vs. Online
So what do we mean when we say that reading print is different from reading online?
- First, when you read something—let’s say, a book—that’s been printed by a reputable publishing house, you can assume that the work is authoritative. The author had to be vetted by a publishing house and multiple editors, right? But when you read something online, it might have been written or posted by anybody. This means that you have to seriously evaluate the authority of the information you’re reading. Pay attention to who was writing what you’re reading—can you identify the author? What are his or her credentials?
- Second, in the print world, texts may include pictures, graphics, or other visual elements to supplement the author’s writing. But in the digital realm, this supplementary material might also include hyperlinks, audio, and video, as well. This will fundamentally change the reading experience for you because online reading can be interactive in a way that a print book can’t. An online environment allows you to work and play with content rather than passively absorbing it.
- Finally, when you read in print, you generally read sequentially, from the first word to the last. Maybe you’ll flip to an index or refer to a footnote, but otherwise the way you read is fairly consistent and straightforward. Online, however, you can be led quickly into an entirely new area of reading by clicking on links or related content. Have you ever been studying for class and fall down a Wikipedia rabbit hole while looking for unfamiliar terms? You might have started by investigating the French Revolution, but half an hour later you find yourself reading about the experimental jazz scene in 1970s New York. You can’t really do that with a book.
Why, What, How?
Now that you’ve heard about how reading online differs from reading print, you should know that this has some really practical consequences for reading comprehension—how to understand and apply what you’re reading. Improving your online reading comprehension will save you time and frustration when you work on your assignments. You’ll be able to understand your course subject matter better, and your performance on your quizzes and exams will improve.
| Why? | “Why am I being asked to read this passage?” | In other words, what are the instructions my professor has given me? |
| What? | “What am I supposed to get out of this passage?” | That is, what are the main concerns, questions, and points of the text? What do you need to remember for class? |
| How? | “How will I remember what I just read?” | In most cases, this means taking notes and defining key terms. |
When you keep the “why, what and how” of reading comprehension in the forefront of your mind while reading, your understanding of the material will improve drastically. It will only take a few minutes, but it will not only help you remember what you’ve read, but also structure any notes that you might want to take.
Student Q & A
Let’s consider some questions about online reading, courtesy of students just like you.
Question: I’m so used to reading printed texts, and I actually prefer it because I don’t get distracted as easily as I do when I’m online. So how can I keep myself from getting distracted when reading online?
- Answer
-
When you read online, the hyperlinks, images, audio, and video interactivity embedded in the text can be a really tempting distraction. Try reading a passage straight through at least once without clicking on any of the hyperlinks or participating in any of the interactive opportunities. First, get a basic “feel” for the passage, then read it with the interactive components to augment your reading.
Question: I once had a teacher who didn’t want us use our phones to read our assigned texts. Why did she care?
- Answer
-
She’s probably right—it’s best not to read your assignments from the small screen of a smart phone. It’s too easy to miss words and meanings when the reading process itself is challenging.
Question: You’ve talked a lot about comprehension, but I’d really like to know how I can improve my online reading speed. Got any tips?
- Answer
-
So glad you asked! Reading quickly and efficiently will leave you more time to study, and improve your performance in your course.
To read more quickly and efficiently online, try most of all to avoid distractions like ads, pop-ups, or hyperlinks that will lead you away from your assignment. Another tactic you can try is to scan the page before actually reading, focusing on key words and phrases rather than every single word. It will not only help you to read faster, it’ll also give you a sense of the text’s main ideas.
How to Read Graphs
Line graphs and bar graphs are both visual ways of representing two or more data sets and their interrelation. In other words, graphs are pictures that show you how one thing changes in relation to another. Learning to read graphs properly is a matter of interpreting which pieces of information go together.
Steps for Reading Graphs
1. Identify what the graph represents. Most graphs will have a clearly labeled x-element, spaced along the graph’s horizontal axis, and a clearly labeled y-element, spaced along the graph’s vertical axis.
- The graph’s title should also tell you exactly what it’s about.
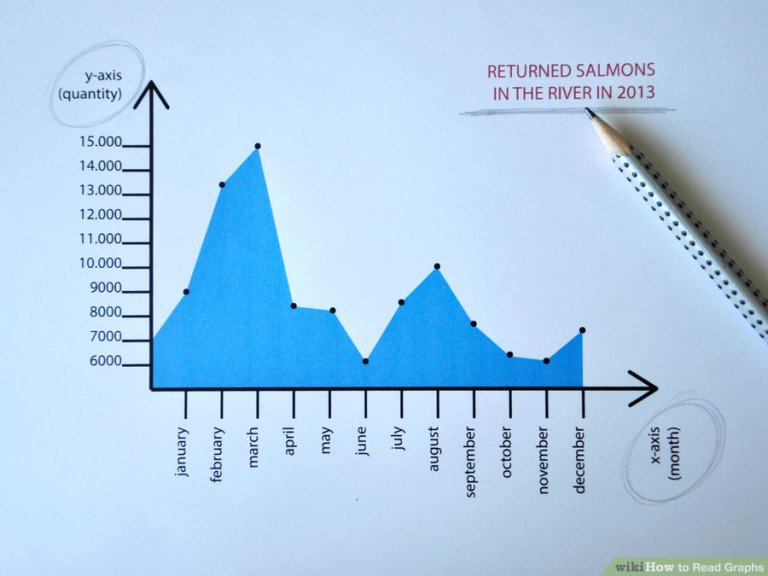
Figure \(\PageIndex{2}\)
2. Check the scale for each graph element. This applies to both line graphs and bar graphs.
- For example, if you’re looking at a graph that shows how many salmon returned to a given stream over the period of a few months last year, each increment along the graph’s y-axis might represent hundreds, thousands or tens of thousands of salmon returning; you won’t know which scale numbers apply until you check the graph.
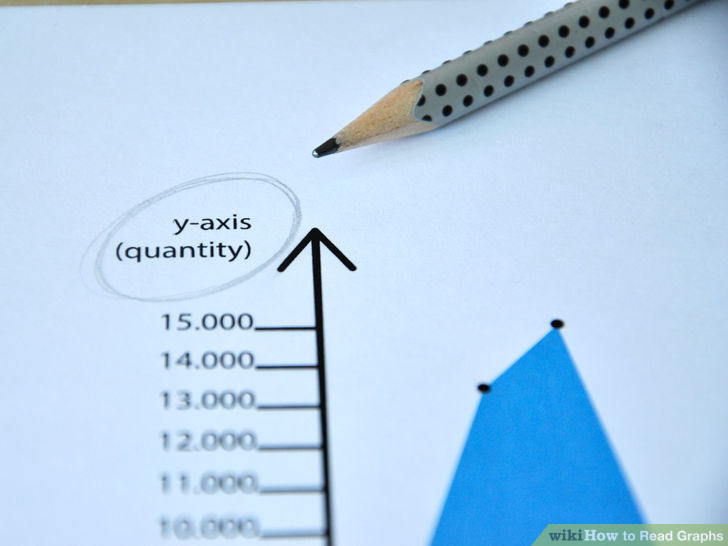
Figure \(\PageIndex{3}\)
3. Locate the graph element you want information on.
- For example, you might want to know how many salmon returned to the stream in question in August of last year. So you’d read across the graph’s horizontal axis until you find “August.”
- Time elements, such as days, weeks, months or years, are almost always listed along the horizontal (“x”) axis. Quantity measurements are almost always listed along the vertical (“y”) axis.
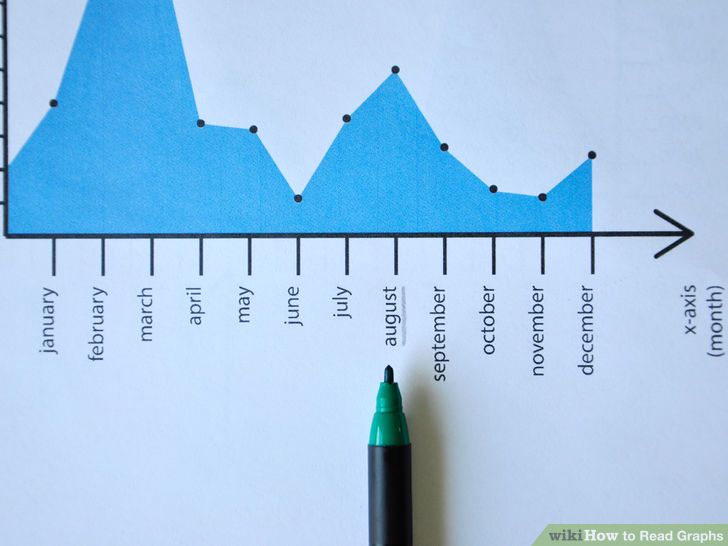
Figure \(\PageIndex{4}\)
4. Read directly up from “August” until you find a dot or a slanting line, on a line graph, or the top of a bar for a bar graph. Then read straight across to the left until you hit the graph’s labeled y-axis. Whatever quantity that line intersects with is the measurement for salmon return in August.
- So if you read up to the dot, line or top of the bar for salmon in August then read across to the left and hit “10,000,” you know 10,000 salmon returned in August. If you hit a point between any two labeled graph increments, you have to estimate based on where you land between the 2 increments. For example, if you hit a point halfway between 10,000 and 15,000, you can safely estimate that the correct number is about 12,500.
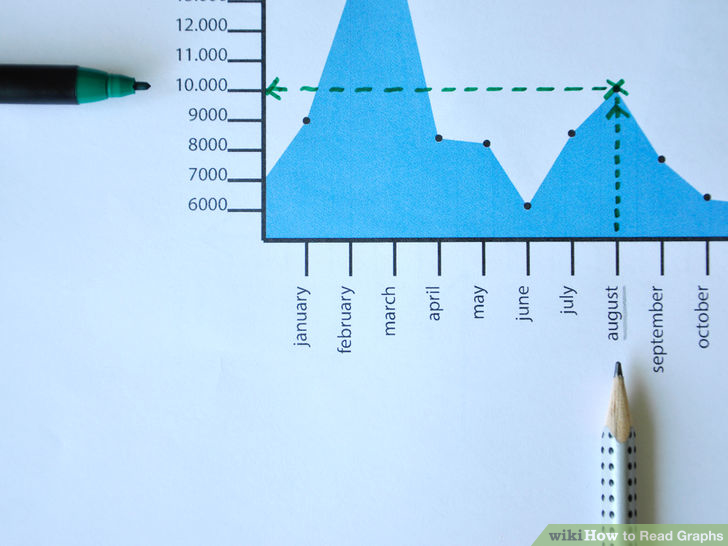
Figure \(\PageIndex{5}\)
FINAL TIPS FOR READING GRAPHS
- Line graphs give you 1 piece of explicit information that bar graphs don’t. The steepness of the line connecting each data point on the graph (that is, each dot) indicates the rate of change. A steeply descending line, for example, would show that salmon returns dropped abruptly from 1 month to the next. But a slowly ascending line represents a gradual increase.
- If the graph correlates more than 2 elements, the extra data sets are usually assigned to the x-, or horizontal axis. Often, the additional data sets are graphed in another color to avoid confusion. So if you want to compare the salmon returns over the same months for more than 1 year at a time, you could graph each year’s return on the same graph, but in a different color.
How to Read Textbooks
Similar academic reading strategies apply to all kinds of readings you’ll do in college. Practicing the habits of previewing, active reading, reviewing, and summarizing will continue to help you learn, no matter the type of class you’re reading for.
In addition to these general strategies, this visual offers advice specific to reading textbooks to get the most out of what you’re reading.
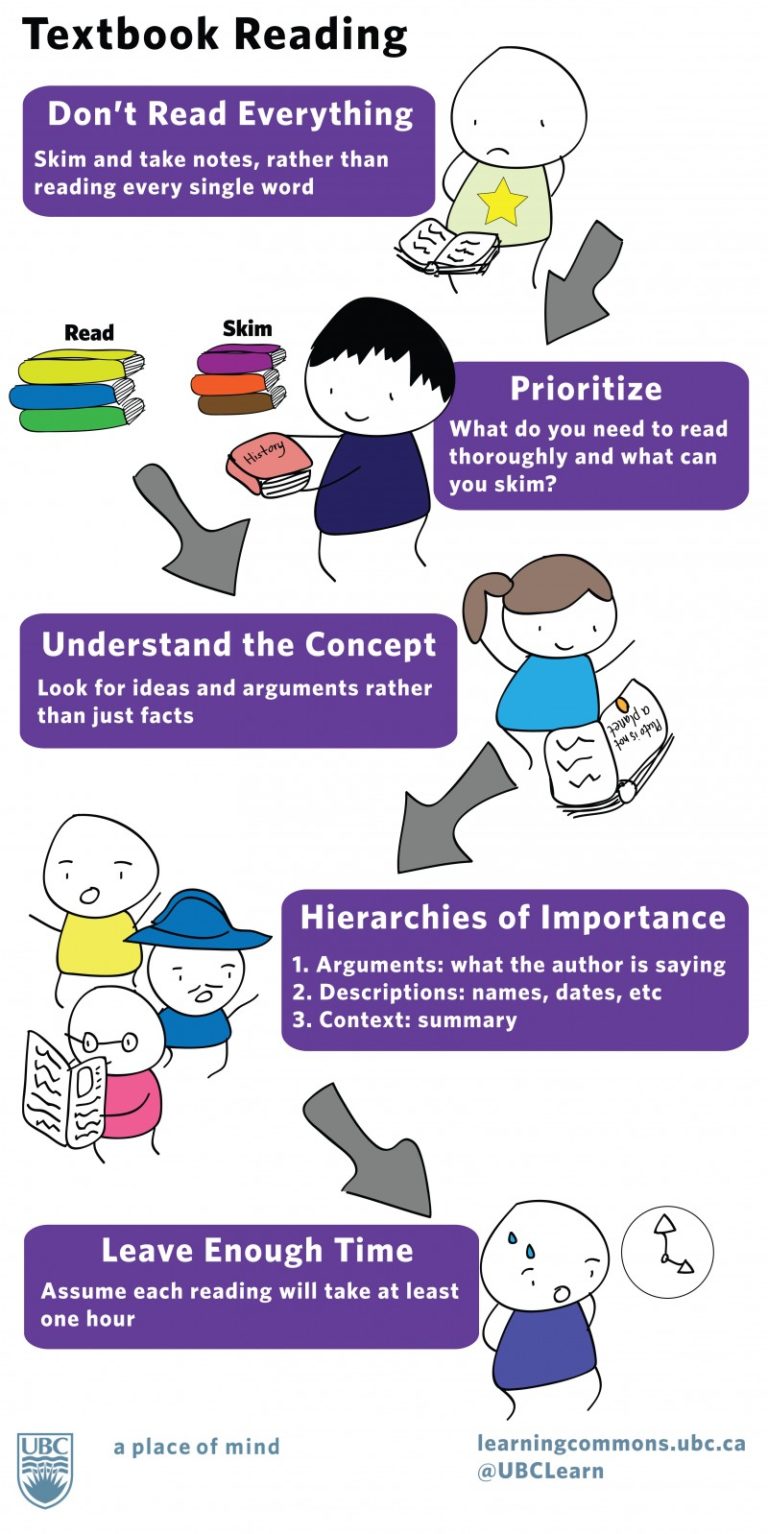
Figure \(\PageIndex{6}\)
To take this advice even further, the following videos consider the specific needs for particular types of classes you’re likely to take.
Math Texts
This overview video introduces some general concepts of how to read and study from math textbooks.
The second part of the series shows examples of concepts from the first video, as well as a summary of approaches useful when reading math.
Science Texts
This video debunks myths students might believe about reading science textbooks. It also introduces a specific type of note-taking, called the Cornell Method, which is useful for other types of academic reading as well.
Social Science Texts
This video models reading a Psychology textbook. The same techniques will be useful with other social science books, including Sociology, History, and Anthropology. It includes nice tips regarding tables and graphs.