
15.2: Inferences from Samples to Populations
- Page ID
- 95149

We frequently use sample statistics to draw inductive inferences about population parameters. When a newspaper conducts a poll to see how many people think President Trump should be impeached, they check with a sample, say 2,000 adults across the U. S. and draw a conclusion about what American adults in general think. Their results would be more accurate if they checked with everyone, but when a population is large, it simply isn’t practical to examine all its members. We have no choice but to rely on a sample from the population and make an inference based on it. When scientists engage in such inferences, they are said to be using inferential statistics. But all of us draw inferences from samples to populations many times every day.
Sampling in Everyday Life
Inferences based on samples are common in medical research, the social sciences, and polling. In these settings, scientists use what are called inferential statistics to move from claims about samples to conclusions about populations.
But we all draw similar inferences many times each day. You are driving through Belleville, KS for the first time and trying to decide where to eat. You have had good experiences at McDonalds restaurants in the past (the set of McDonald’s restaurants where you have eaten in the past at constitutes your sample). So, you might conclude that all McDonald’s restaurants (the population) are likely to be good and decide to sample the culinary delights of the one in Belleville. Or suppose you know six people (this is your sample) who have dated Wilbur, and all of them found him boring. You may well conclude that almost everyone (this is the population) would find him boring.
Whenever you make a generalization based on several (but not all) of the cases, you used sampling. You are drawing a conclusion about some larger group based on what you’ve observed about one of its subgroups.
Learning
Most learning from experience involves drawing inferences about unobserved cases (populations) from information about a limited number of cases that we have observed (our samples). You know what strategies worked in the cases you have experienced (your sample) for getting a date, quitting smoking, getting your car running when the battery seems dead, or doing well on an exam. And you then draw conclusions about the relevant populations based on this knowledge.
An examination is really a sampling procedure to determine how much you have learned. When your calculus professor makes up an examination, they hope to sample items from the population of things you have learned in the course and to use your grade as an indicator of how much information you have acquired.
Samples and Inference
We often infer a conclusion about a population from a description of a sample that was drawn from it. When we do:
- Our premises are claims about the sample.
- Our conclusion is a claim about the population.
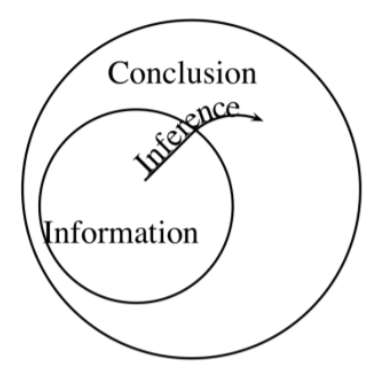.png?revision=1&size=bestfit&width=264&height=268)
For example, we might draw a conclusion about the divorce rate of people living in Florida from premises describing the divorce rates among 800 couples that our school’s Human Relations Department sampled.
In such a case, our inference is not deductively valid. It involves an inductive leap. The conclusion goes beyond the information in the argument’s premises, because it contains information about the entire population, while the premises only contain information about the sample. But if we are careful, our inference can still be inductively strong. This means that if we begin with true premises (which in this case means a correct description of the sample), we are likely to arrive at a true conclusion (about the entire population).
Good Samples
A good inductive inference from a sample to a population requires:
- A large enough sample.
- A representative (unbiased) sample.
We would need to delve more deeply into probability to say exactly how large is large enough, but we won’t worry about that here. The important point is that in everyday life we very often rely on samples that are clearly too small.
We also need a sample that is as representative of the entire population as possible. A sample that is not representative is said to be biased. An unbiased sample is typical of the population. By contrast, in a biased sample, some portions of the population are overrepresented and others are underrepresented.
The problem with a very small sample is that it is not likely to be representative. Other things being equal, a bigger sample will be more representative. But there are costs to gathering information—a price in time, dollars, and energy—so it is rarely feasible to get huge samples.
We can never be certain that a sample is unbiased, but we can strive to avoid any non-trivial biases we can discover. With some thought, the worst biases are often obvious. Suppose, for example, that we want to know what the U.S. adult public (our population) thinks about the consumption of alcohol. We would clearly get a biased sample if we distributed questionnaires only at a pool hall (we would have an overrepresentation of drinkers and an underrepresentation of those favoring temperance), or only at the local meetings of MADD (here, the biases would be reversed).
A classic example of a biased sample occurred in 1936, when a magazine, The Literary Digest, conducted a poll using names in telephone directories and on car registration lists. Most of the people they sampled favored Alf Landon over Franklin Roosevelt in that year’s Presidential election, but when election day rolled around, Roosevelt won in a landslide. What went wrong? News organizations now use telephone polling routinely, but in 1936, a relatively small percentage of people had telephones and cars, and most of them were affluent. These were the people most likely to vote for the Republican candidate, Landon, and so the sample was not representative of all voters.
There are other cases where bias is likely, even though it won’t be this blatant. For example, any time members of the sample volunteer, e.g., by returning a questionnaire in the mail, we are likely to have a biased sample. People willing to return a questionnaire are likely to differ in various ways from people who are not. Or, to take an example closer to home, tests that focus on only some of the material covered in class are likely to elicit a biased, unrepresentative sample of what you have learned. They aren’t a fair sample of what you know. Unfortunately, in some cases biases may be difficult to detect, and it may require a good deal of expertise to find it at all.
Random Sampling
The best way to obtain an unbiased sample is to use random sampling. A random sample is a method of sampling in which each member of the population has an equally good chance of being chosen for the sample. Random sampling does not guarantee a representative sample—nothing short of checking the entire population can guarantee that—but it does make it more likely. Random sampling avoids the biases involved with many other methods of sampling.
We can rarely get a truly random sample, but under some conditions, typically in carefully conducted studies and surveys, we can come reasonably close. But even in daily life we can use samples that are much less biased than those we often rely on.
Random Digit Dialing (RDD)
Modern technology now allows national polling organizations with large resources to approach the ideal of random sampling. Polls like the New York Times/CBS News poll use what is called Random Digit Dialing (RDD). The goal here is to give every residential phone number an equal chance of being called for an interview. Nowadays, almost all major polls use some form of RDD. For example, the New York Times/CBS News poll uses the GENESYS system, which employs a database of over 42,000 residential telephone numbers throughout the U.S. that is updated every few months. The system also employs software that draws a random sample of phone numbers from this database and then randomly makes up the last four digits of the number to be called. Of course, some sorts of people are harder to reach on the phone than others, and some sorts are more willing to volunteer information over the phone (the elderly tend to be more available, more willing to share, and more likely to answer an unknown number, for instance). But RDD constitutes an impressive step in the direction of randomization.
Stratified Random Sampling
Scientists sometimes go a step further and use a stratified random sample. Here, the aim is to ensure that there is a certain percentage of members of various subpopulations in our sample (e.g., an equal number of men and of women). They separate the population into relevant categories or “strata” before sampling (e.g., into the categories or subpopulations of men and of women). Then they sample randomly within each category. The thinking here is that results will be more accurate than mere random sampling because random sampling might accidentally over-weigh some group (because they were sampled at a higher rate through variance). So, rather than doing a random statewide poll about who is favored in the gubernatorial election, a poll using stratified random polling would make sure to poll all counties in proportion to turnout expectations (they might also stratify further based on gender, race, education, etc.).
Polls
A growing practical problem in recent years has been the decline in the public’s participation in polls. Pollsters are getting more and more “nonresponses.” Some of these result from the difficulty in contacting people by phone (people are at work, unwillingness to answer unknown numbers, etc.). But those contacted are also less willing to participate than they were in the past. The reasons for this aren’t completely clear, but growing disillusionment with politics and lack of patience for unsolicited calls resulting from the increase in telemarketing may be part of the reason.
The use of push polling also leads to a wariness about polls. Push polling is not really polling at all. Instead, an organization, e.g., the campaign organization of a candidate running for Senate, calls thousands of homes. The caller says they are conducting a poll, but in fact no results are collected and instead a damaging— and often false—claim about the other side is implanted in what is presented as a neutral question. For example, the caller might ask, “Do you agree with Candidate X’s goal to cut social security payments over the next six years?” Such deceptive uses of polling are likely to make the public more cynical about polls.
Sampling Variability
It is unlikely that any sample that is substantially smaller than the parent population will be perfectly representative of the population. Suppose that we drew many samples of the same size from the same population. For example, if we drew many samples of 1,000 each from the entire population of Oklahoma voters. The set of all these samples in called a sampling distribution.
The samples in our sampling distribution will vary from one to another. This just means that if we draw many samples from the same population, we are likely to get somewhat different results each time. For example, if we examine twenty samples, each with 1,000 Oklahoma voters, we are likely to find different percentages of Republicans in each of our samples.
This variation among samples is called sampling variability or sampling error (though it is not really an error or mistake). Suppose that we just take one sample of 1,000 Oklahoma voters and discover that 60% of them prefer the Republican candidate for Governor. Because of sampling variability, we know that if we had drawn a different sample of the same size, we would probably have gotten a somewhat different percentage of people favoring the Republican. So, we won’t be able to conclude that exactly 60% of all Oklahoma voters favor the Republican from the fact that 60% of the voters in our single sample do.
As our samples become larger, it becomes less likely that the sample mean will be the same as the mean of the parent population. But it becomes more likely that the mean of the sample will be close to the mean of the population. Thus, if 60% of the voters in a sample of 10 favor the Republican candidate, we can’t be very confident in predicting that about 60% of voters in general do. If 60% of a sample of 100 do, we can be more confident, and if 60% of a sample of 1,000 do, we can be more confident still.
Statisticians overcome the problem of sampling variability by calculating a margin of error. This is a number that tells us how close the result of a poll should usually be to the population parameter in question. For example, our claim might be that 60% of the population, plus or minus three percent, will vote Republican this coming year. The smaller the sample, the larger the margin of error.
But there are often large costs in obtaining a large sample, so we must compromise between what’s feasible and the margin of error. Here you do get what you pay for. It is surprising, but the size of the sample does not need to be a large percentage of the population for a poll or survey to be a good one. What is important is that the sample not be biased, and that it be large enough; once this is achieved, it is the absolute number of things in the sample (rather than the proportion of the population that the sample makes up) that is relevant for taking a reliable poll. In our daily life, we can’t hope for random samples, but with a little care we can avoid flagrant biases in our samples, and this can improve our reasoning dramatically.
Bad Sampling and Bad Reasoning
Many of the reasoning errors we will study in later chapters result from the use of small or biased samples. Drawing conclusions about a general population based on a sample from it is often called generalization. And drawing such a conclusion from a sample that is too small is sometimes called the fallacy of hasty generalization or, in everyday language, jumping to a conclusion.
Our samples are also often biased. For example, a person in a job interview may do unusually well (they are striving to create a good first impression) or unusually poorly (they may be very nervous). If so, their actions constitute a biased sample, and they will not be an accurate predictor of the candidate’s future job performance. In coming chapters, we will find many examples of bad reasoning that result from the use of samples that are too small, highly biased, or both.
Example: The Two Hospitals
There are two hospitals in Smudsville. About 50 babies are born every day in the larger one, and about 14 babies are born every day in the smaller one down the street. On average, 50% of the births in both hospitals are girls and 50% are boys, but the number bounces around some from one day to the next in both hospitals.
- Why would the percentage of boys vary from day to day?
- Which hospital, if either, is more likely to have more days per year when over 65% of the babies born are boys?
We all know that bigger samples are likely to be more representative of their parent populations. But we often fail to realize that we are dealing with a problem that involves this principle; we don’t “code” it as a problem involving sample size. Since about half of all births are boys and about half are girls, the true percentages in the general population are about half and half. Since a smaller sample will be less likely to reflect these true proportions, the smaller hospital is more likely to have more days per year when over 65% of the births are boys. The births at the smaller hospital constitutes a smaller sample.
This will seem more intuitive if you think about the following example. If you flipped a fair coin four times, you wouldn’t be all that surprised if you got four heads. The sample (four flips) is small, so this wouldn’t be too surprising; the probability is 116. But if you flipped the same coin one hundred times, you would be very surprised to get all heads. A sample this large is very unlikely to deviate so much from the population of all possible flips of the coin.
Exercises
- What is the probability of getting all heads when you flip a fair coin (a) four times, (b) ten times, (c) twenty times, (d) one hundred times?
In 2–7 say (a) what the relevant population is, (b) what the sample is (i.e., what is in the sample), (c) whether the sample seems to be biased; then (d) evaluate the inference.
- We can’t afford to carefully check all the computer chips that come off the assembly line in our factory. But we check one out of every 300, using a randomizing device to pick the ones we examine. If we find a couple of bad ones, we check out the whole bunch.
- We can’t afford to carefully check all the computer chips coming off the assembly line. But we check the first few from the beginning of each day’s run. If we find a couple of bad ones, we check out the whole bunch.
- There are more than a hundred nuclear power plants operating in the United States and Western Europe today. Each of them has operated for years without killing anybody. So, nuclear power plants don’t seem to pose much of a danger to human life.
- Joining the Weight Away program is a good way to lose weight. Your friend Millie and uncle Wilbur both lost all the weight they wanted to lose, and they’ve kept if off for six months now.
- Joining the Weight Away program is a good way to lose weight. Consumer Reports did a pretty exhaustive study, surveying hundreds of people, and found that it worked better than any alternative method for losing weight. [This is a fictitious example; I don’t know the success rates of various weight-reduction programs.]
- Alfred has a good track record as a source of information about the social lives of people you know, so you conclude that he’s a reliable source of gossip in general.
- Pollsters are getting more and more “nonresponses.” Some of these result from the difficulty in contacting people by phone (people are at work, screening unknown numbers, etc.). But those contacted are also less willing to participate than they were in the past. Does this automatically mean that recent polls are more likely to be biased? How could we determine whether there are? In which ways might they be biased (defend your answer)?
- We began the chapter with the story of cats that had fallen from windows. What could account for these finding?
- Several groups of studies have shown that the survival rates of patients after surgery is actually lower in better hospitals than in hospitals that aren’t as good. More people die in the better hospitals. What might account for this?
- The psychologist Robyn Dawes recounts a story about his involvement with a committee that was trying to set guidelines for professional psychologists. They were trying to decide what the rules should be for reporting a client (and thus breaching confidentiality) who admitted having sexually abused children, when the abuse occurred in the distant past. Several people on the committee said that they should be required to report it, even when it occurred in the distant past, because the one sure thing about child abusers is that they never stop on their own without professional help. Dawes asked the others how they knew this. They replied, quite sincerely, that as counselors they had extensive contact with child abusers. Does this give us good reason to think that child abusers rarely stop on their own? What problems, if any, are involved in the group’s reasoning?
- A poll with a 4% margin of error finds that 47% of voters surveyed plan to vote for Smith for Sheriff and 51% plan to vote for her opponent, Jones. What information would you like to know in evaluating these results? Assuming sound polling procedures were used, what can we conclude about who will win the election?
- Suppose that a polling organization was worried that a telephone poll would result in a biased sample. So instead, they pick addresses randomly and visit the residences in person. They have limited resources, however, and so they can only make one visit to each residence, and if no one is home they just go on to the next place on their list. How representative is this sample likely to be? What are its flaws? Could they be corrected? At what cost?
- Suppose that you are an excellent chess player and that Wilbur is good, but not as good as you. Would you be more likely to beat him in a best of three series or in a best of seven series (or would the number of games make any difference)? Defend your answer.
- A study was conducted by the Centers for Disease Control and Prevention was reported in the Journal of the American Medical Association (JAMA). The study was based on a survey of 9,215 adult patients who were members of Kaiser Permanente health maintenance organization (an HMO). The study focused on eight childhood traumas, including psychological, physical and sexual abuse, having a mother who was abused, parents who are separated or divorced, and living with those were substance abusers, mentally ill, or who had been imprisoned. It was found that more instances of trauma seemed to increase the probability of smoking. For example, people who experienced five or more instances of trauma were 5.4 times more likely to start smoking by the age of 14 than were people who reported no childhood trauma. Analyze this study. What was the sample and the population? What are possible strong points and weak points?
In 16 and 17 explain what (if anything) is wrong in each of the following examples. When reasoning goes wrong, it often goes very wrong, so it’s quite possible for even a short argument to be flawed in more than one way.
- Suppose that the NRA (National Rifle Association) recently conducted a poll of its members and found that they were overwhelmingly opposed to any further gun control measures.
- Suppose that a random sample of 500 students at our college showed that an overwhelming majority do not think that the school needs to budget more money for making the campus more accessible to people with disabilities.
- A TV psychologist recently noted that the average marriage lasts 7 years, a fact that she sought to explain by pointing to evidence that life goes in 7 year cycles (so that it was not surprising that marriages should last 7 years). How may she have misunderstood the fact that she was explaining?
- Answers to Selected Exercises
-
10. The actual cause, though you could only hypothesize it based on the information in this problem, turns out to be that high-risk patients, those needing the most dangerous types of surgery, often go to better hospitals (which are more likely to provide such surgery, or at least more likely to provide it at a lower risk).
14. Hint: think about the hospital example above.