
14.1: Correlations
- Page ID
- 22041

A correlation is a connection or association between two kinds of things. For example, scientists are interested not only in statistics about who has lung cancer, but also in how smoking is related to lung cancer. This relationship is one of apparent connection, and it is described mathematically by saying that the values of the variable "number of smokers in a group" and the variable "number of lung cancer cases in that group" are correlated. The word correlated is a technical term. Finding a correlation in your data between two variables A and B is a clue that there may be some causal story for you to uncover, such as that A is causing B, or vice versa.
Suppose that a scientific article reports that smoking is positively correlated with lung cancer. What this means or implies is that groups of people with a high percentage of smokers usually also have a high percentage of lung cancer cases, and groups with a low percentage of smokers usually also have a low percentage of lung cancer cases.
Here is another way to make the same point. The two percentages tend to rise and fall together across many groups. If A = percent of smokers in any group and B = percent of lung cancer cases in the same group, then the scientific article is reporting that values of the variable A tend to go up and down as values of the variable B also go up and down.
If the values of the variable A tend to increase and decrease in synchrony (parallel) with the values of the variable B, then there is a positive correlation between the values of A and the values of B.
When the values of A and the values of B are positively correlated, we also say that the variables themselves are positively correlated.
Pressure and volume of a contained gas are negatively correlated. When you increase the pressure, you usually notice a decrease in volume, and vice versa.
If A tends to increase when B decreases and vice versa, then there is negative correlation between A and B.
If A changes haphazardly as B changes, then there is no correlation between A and B.
Being correlated is a matter of degree. Also being correlated negatively or positively implies that the two variables are not independent of each other. If we were to delete the phrase tends to from the first two definitions, we would have perfect correlations. When A always increases with increases in B, and always decreases with decreases in B, then A and B are perfectly positively correlated. When scientists say two variables are directly proportional, they mean that a perfect positive straight-line correlation exists between them. A perfect negative correlation between two variables, such as the pressure and volume of an ideal gas, is often expressed by saying they are inversely proportional. The accompanying graphs show some of these possible relationships between two variables A and B.
In the two top, straight-line graphs, we have evidence that A is directly proportional to B. In the second, we have evidence that A is inversely proportional to B. When A is correlated with B, it follows with certainty that B will be correlated with A, and vice versa. In other words, correlation is a symmetrical relationship.1
We’ve introduced correlations by talking about variables, but correlations can also occur among characteristics. For example, there's a correlation between the characteristic of being a Canadian and the characteristic of owning a warm, hooded coat. The characteristic "being a Canadian" can be thought of as a variable with two values "characteristic is present” and "characteristic is absent." In other words, the characteristic C can be thought of as a variable with the possible values of "present" and "absent" or the values C and Not-C. With this sort of variable, it doesn't make sense to talk about their values "changing in synchrony." Here are some new definitions of correlation that apply to these kinds of characteristics:
A is positively correlated with B in a given population whenever the percentage of A's among B’s is greater than the percentage of A's among the Non B’s
A is negatively correlated with B in a given population whenever the percentage of A's among the B’s is less than the percentage of A's among the Non B’s.
A and B are uncorrelated if the percentages of A's among the B’s is the same as among the Non-B's.
For example, being tall is positively correlated with being a professional basketball player because you'll find a higher percentage of tall people among the players than among the non-players. In applying the above definition of positive correlation, we would let
A = tall people
B = professional basketball players
Non-B = people who aren't professional basketball players
Is there any correlation between being Canadian and having a banana tree in one's backyard? Yes, definitely. Randomly examine groups of people. The higher the percentage of Canadians, the fewer people in the group who will have a banana tree in their backyard. There is a negative correlation.
Given our common knowledge about horse racing and the jockeys who ride the horses, is there any correlation between a person’s body weight and their being a professional jockey?
a. Yes, they are positively correlated.
b. Yes, they are negatively correlated.
c. No, they are uncorrelated.
- Answer
-
Answer (b). In a group of jockeys, you’d expect the average weight to be less than the average weight of most people in society
Correlation is a matter of degree. Some correlations are strong; some are weak. If the percentage of people with lung cancer were only slightly higher among smokers than nonsmokers, the correlation between lung cancer and smoking would be weak. In reality, however, the percentage of people with lung cancer is twenty times higher among smokers than nonsmokers, so the correlation is very strong.
The strength of the correlation between characteristics A and B is proportional to the difference between the percentage of B's that are A and the percentage of Not-B's that are A.2
Are U.S. income taxes correlated with citizens' gross incomes? Positively or negatively? Strongly or weakly? Perfectly?
- Answer
-
U.S. income taxes are positively correlated with citizens' gross incomes. The correlation is not perfect, but it is fairly strong. The correlation is weak in the highest income brackets, where those persons tend to pay proportionately a fairly small percentage of their income in taxes thanks to tax shelters.
Some persons find correlations where others do not. Here is a dispute that occurred many years ago. The lobbyist for the Associated Anglers of the Colorado River claimed there is a correlation between the number of striped bass in the Colorado River and the amount of water taken out of the river by the State of Nevada. A housing developer in Las Vegas said he sees no correlation. Who is correct? Well, let’s look at the data. The lobbyist and the housing developed do not disagree on the raw data. Here are some charts of this data from the previous century:
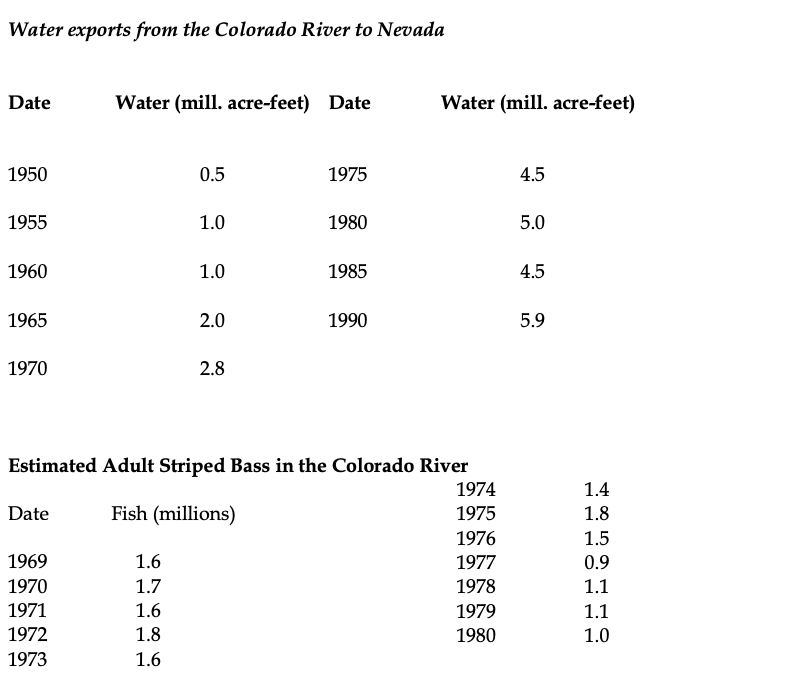
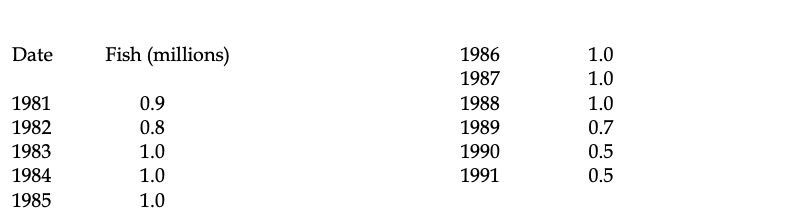
How can you look at these two sets of data and tell whether a correlation exists? If you look for trends in the data, you will notice that through time the exports of water have increased, while the number of fish have more or less decreased. As one goes up, the other comes down, which is a sign of a negative correlation. Only a statistician can tell how strong the correlation is, but you can tell from the trends that a correlation is present and that it is unlikely to be due to accidental fluctuations in the levels of water and fish.
1 We’ve been using discrete, not continuous variables; that is, the points on the graphs are disconnected. Many variables are continuous rather than discrete—for example, time, altitude, and degree of satisfaction with a politician. Continuous variables can always be turned into discrete variables by dividing the continuum into separate categories; for example, the continuous variable time could be replaced with the discrete variable time-to-the-nearest-minute. Correlation between two variables can actually be quantified. That is, a number can be assigned to the correlation. The number, called the correlation coefficient, can range from minus one for a negative correlation to plus one for a positive correlation. In this chapter, we will not investigate how to calculate these coefficients. The correlation coefficient is a measure of how well a straight line graph will represent the data. Consider a graph that looks like this:
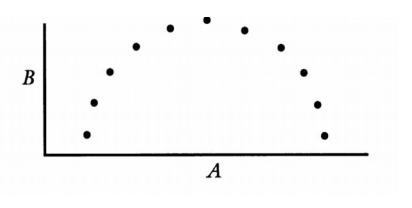
This graph has a small correlation coefficient, so a straight line does not do a good job of representing this graph. Nevertheless, there is clearly some sort of correlation between A and B. It is a nonlinear correlation.
2 Statisticians prefer to use a somewhat more complicated measure of strength for correlations, but this definition can be quite helpful as a rule of thumb.