
2.4: What Is Data Visualization?
- Page ID
- 47361

Think of the maps you see produced by the television station or website from which you get your weather information. While the meteorologist explains that northern Florida has highs in the 70s, central Florida has highs in the 80s, and southern Florida has highs in the 90s, that information is accompanied by a map. That map may simply have numbers on it, but it also likely has color added to it, with yellow representing a certain range of temperatures, orange representing a warmer range of temperatures, and red representing even hotter temperatures. These colors provide the audience with an additional way of understanding weather patterns. It’s not that we don’t understand that the “110” hovering over Brownsville, Texas is extremely hot; the dark red color of that area simply reinforces the idea, making it easy for us to quickly absorb information without having to process the actual posted high temperatures.
Sometimes it is beneficial to add visuals into your technical writing, especially if there are a lot of numbers or other types of data involved. Data visualizations such as graphs, charts, tables, and maps organize and communicate information in a way that is accessible to multiple audiences. Depending on the type of visualization, the visualization can help the user lookup specific values or identify patterns hidden within the data.
There are many different types of data visualizations that can be and are used, depending on the purpose of the writer and the needs of the audience. Maps can be used to show not only high and low temperatures but also to identify voting patterns or patterns of income across a country. Records of high and low temperatures for the past ten years, or how much people in different professions make annually, can be presented in tables. Tables can also be used to compare and contrast different products. Sales records may be tracked using a line graph in order to see the rise and fall of sales throughout a quarter or a year; these same records could be presented in a table if the purpose is to be able to look up how many of a particular type of item was sold in a given month, quarter, or year.
Sometimes, more complex visualizations are necessary in order to identify the patterns hidden within the information. Consider, for instance, some of the patterns that David McCandless identifies in the visualizations he presents in this TED Talks (http://www.ted.com/talks/david_mccandless_the_beauty_of_data_visualization?language=en) video, or McCandless’s visual depiction of 20th Century Death(http://www.informationisbeautiful.net/visualizations/20th-century-death/), where he breaks down the number of deaths according to categories, such as Humanity, and subcategories, such as War, Drugs, and Air Pollution. By breaking down causes of death in the 20th Century Death chart, McCandless enables readers to visualize the impact that diseases such as Smallpox, Tuberculosis, and Whooping Cough had during the 1900s, and compare them to other causes of death such as Road Traffic and Air crashes.
PURPOSE OF DATA VISUALIZATIONS
According to Stephen Few, the purpose of data visualizations “is to communicate important information effectively” (9). As technical communicators, it is our job to use design in order to help our readers understand what the information says the numbers say (9).
More specifically, the purposes of tables, graphs, and other types of data visualizations are to
- Clearly indicate how values relate to one another
- Represent quantities accurately
- Make it easy to compare quantities
- Make it easy to see the ranked order of values
- Make obvious how people should use the information
(Few, “Data Visualization for Human Perception”)
An extensive description of every type of data visualization would be beyond the scope of the article; there are entire books written on this topic, and if you want to design in-depth, effective visuals, you should read more of Stephen Few’s or Edward Tufte’s works. The following are some descriptions of common genres and best practices for some of the types of visualizations you may use in your professional and technical communications classes and real-world writing experiences.
TABLES
Tables, “lists of data presented in a system of rows and columns” (Dobrin, et al), are useful if you want the reader to be able to look up specific values. Your professional and technical communications instructor, for instance, likely keeps some form of a gradebook such as depicted in Table \(\PageIndex{1}\):
| Student ID | Exam 1 | Exam 2 | Exam 3 | Homework |
| 12345 | 97 | 75 | 82 | 95 |
| 23456 | 79 | 79 | 81 | 90 |
| 34567 | 45 | 78 | 83 | 100 |
| 45678 | 99 | 98 | 100 | 100 |
| 56789 | 25 | 75 | 82 | 70 |
With a table, the data is organized in clearly defined rows and columns, and the instructor can easily look up the grade that each student received on an individual assignment.
DESIGN TIPS FOR TABLES
You’ve probably seen a lot of tables in your lifetime, and some have probably been easier to read than others. The following are some guidelines for designing tables effectively:
- Label each row and column clearly so that it is easy to lookup values.
- Use a legible font, and use that same font throughout the table (Few, Show, 177).
- Avoid using too much ink. If you include solid lines between all items, the table can become more difficult to read (Few, Show, 160-61). See, for instance, Table \(\PageIndex{2}\), with the same information redesigned to have lines between each item. Notice that the table appears to be more cluttered than it did previously, even though it still has the same amount of information; this amount of clutter will increase if the table has more items. If necessary, light fill colors (Few, Show, 163) such as those used
in Table 1 can be used to allow the reader to scan across lines
more effectively.
| Student ID | Exam 1 | Exam 2 | Exam 3 | Homework |
| 12345 | 97 | 75 | 82 | 95 |
| 23456 | 79 | 79 | 81 | 90 |
| 34567 | 45 | 78 | 83 | 100 |
| 45678 | 99 | 98 | 100 | 100 |
| 56789 | 25 | 75 | 82 | 70 |
GRAPHS AND CHARTS
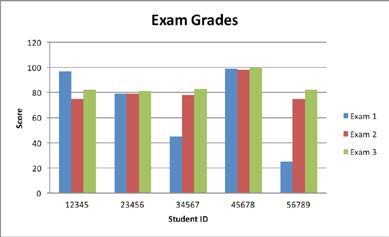
Graphs and charts are useful when the patterns within the data tell a story. While the information was relatively easy to understand already, we’ll use the information from Table \(\PageIndex{1}\) as an example. By transferring the numbers for the students’ exam scores into Graph \(\PageIndex{1}\), it is easy to identify that Student 12345 did better on Exam 1 than he or she did on Exam 2. Students 34567 and 56789, on the other hand, performed much better on Exams 2 and 3 than they did on Exam 1. Students 23456 and 45678, however, performed at approximately the same standard on each exam that they took. These patterns of scores can tell the instructor several pieces of information: Those students who performed consistently likely studied equal amounts for each test, while those who performed better on Exams 2 and 3 than on Exam 1 probably did not study effectively or were having a bad test day for Exam 1.
As data visualization designers, you are certainly not limited to bar graphs.
On the contrary, there are numerous types of graphs and charts that you can use. While Graph \(\PageIndex{1}\) was created with Microsoft Word software, there are much alternative software available, including several free resources online. See the list of Additional Sources at the end of this section for some examples of these resources.
DESIGN TIPS FOR GRAPHS AND CHARTS
- Label your axes clearly.
- If an axis contains quantitative information (numbers that have meaning) and shows only positive numbers, then the axis should begin at 0. In some rare cases, it is acceptable to use a different starting point, but if you are starting with a number other than 0, make sure that you mark that clearly. Some designers use varying axes to distort information, which is unethical.
- Make sure that the spacing is even down columns and across rows. Numerical increments should also be equal down columns and across rows. Using unequal increments is another way to distort information.
GENERAL DESIGN TIPS
When designing tables, graphs, and charts, it is necessary to remember general design tips as well. For starters, let’s consider the CRAP (Contrast, Repetition, Alignment, and Proximity) principles of design, which Robin Williams explains in detail in The Non-Designers’ Design Book.
CONTRAST
When we write essays in Microsoft Word, the default colors are black letters on a white background. The stark contrast between white and black make the words easier to read. Consider, however, how difficult it would be to read yellow font on a white background or red font on a maroon background. It’s more difficult to read those words; we have to pause or squint in order to read them—if we can read them at all.
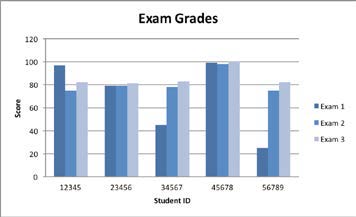
When we design data visualizations, we sometimes have to use color to show different categories or to make the image more visually appealing; we don’t want to be limited to black lettering with a white background. We do, however, need to maintain that level of contrast with the images we design. Look back at Graph \(\PageIndex{1}\); notice that the graph uses blue, red, and green for the bars. These colors differ from each other enough that we can see where one bar ends and the next begins without having to pause or squint. If, however, the bars were all various shades of blue, the data would be more difficult to read. Graph \(\PageIndex{2}\) demonstrates this lack of contrast. While the graph is still readable because it has relatively few items, Graph \(\PageIndex{1}\) is easier to read quickly.
REPETITION
Repeating ideas and colors provide cohesion. Consider the headings and subheadings you see throughout this textbook. Each article heading is written with the same font type, size, and color. This repeated design allows our brains to understand, each time we see that design, that we are looking at a new article within the same textbook.
To apply the principle of repetition to data visualizations, consider Graph \(\PageIndex{1}\) once again. Exam 1 is identified with blue ink for each student, Exam 2 is identified with red ink, and Exam 3 is identified with green ink. The repeated color scheme allows us to quickly associate the exam number and compare that exam across the students. The principle of repetition is especially important if you have multiple visualizations throughout your document. If, for instance, you have three tables in a proposal, you want to demonstrate a sense of cohesion among the tables by using the same font, colors, line width, etc.
ALIGNMENT
It is essential to align texts and graphics in a readable manner. Think about the ways in which books and newspapers in the United States are formatted. Generally, the text is left-aligned or justified; depending on the genre, the beginning of each paragraph may be indented. Because we read from left to right, and our brains are accustomed to seeing text aligned that way, you will rarely see large amounts of text that are right-aligned. For a more in-depth discussion of alignment, look at Clayton Benjamin’s article “Formatting Pages.”
Alignment is perhaps most essential when dealing with tables, especially if you eliminate or reduce the number of lines you use. In fact, proper use of alignment can save you the ink of having a lot of dividing lines. Align quantitative numbers to the right, thus allowing the ones, tens, etc. digits to align. If numbers are present in non-quantitative forms (e.g. the Student IDs in Tables 1 and 2), they can be left-aligned. Most other information should be left-aligned (Few, Show, 171).
PROXIMITY
When two images or pieces of information are placed close to each other, we assume them to be connected in some way. If two images or pieces of information are placed further away from each other, we assume that they are not related or are not closely related. For instance, consider the subheading “Proximity.” There is a space between the last Alignment paragraph and the word Proximity while there is not a space between Proximity and this paragraph. Thus, before we even read the content of the paragraphs, we know that this paragraph belongs with the subheading “Proximity” and not “Alignment,” or another section.
When designing tables, charts, and graphs, it is necessary to place related information close together. For instance, labels for parts of a graph (e.g. the Student IDs numbers in Graphs \(\PageIndex{1}\) and \(\PageIndex{2}\)) are placed as close as possible to that particular student’s scores.
PROBLEMATIC CHART PRACTICES
One type of chart that is particularly popular is the pie chart. While some use them often because they allow the audience to see a basic part-to-whole relationship, they are also often criticized. Few, for instance, indicates that pie charts are ineffective because “[they] [encode] values as visual attributes . . . that we cannot easily perceive and compare” (“Data Visualization”). In other words, a quick glance at a pie chart informs us of general ratios, but it is often difficult to see the difference between amounts. For instance, if one section represents 20% and another represents 23%, the average human eye cannot discern the difference.
Another issue to be aware of is the use of 3D, which many also consider ineffective because the effect renders the information difficult to read accurately. Few indicate that 3D “cannot be applied effectively to graphs on a flat surface (e.g., a page or computer screen), which relies on illusory cues of light and shadow, occlusion, and size to simulate depth. Even if the 3-D position could be used effectively on a flat surface, it is not an effective attribute to use in table and graph design because our perception of depth is weak compared to our perception of height and width” (Show 71).
HOW SHOULD WE REFER TO THE VISUALIZATIONS?
Notice how the tables and graphs were discussed in this article. In order to effectively communicate the information in data visualizations, you need to label the visualizations properly, refer to them in the body of the text, and place them as close as possible to the relevant text. In a sentence or two (or maybe even a paragraph, if necessary) identify the most crucial piece of information you want your audience to get from your visualization. Remember that part of the reason you’re including these visualizations is to reach a wider audience. By pointing out the most relevant information in the text, you can more effectively reach various types of learners.
EXERCISES
- Type “ineffective charts,” “ineffective graphs,” “unethical charts,” or some version thereof into Google Images. Find two or three differently-designed graphs and charts and discuss why the data visualizations are not effective.
- Find a textbook, report, or other documents that include some sort of data visualization. What types of information did the author choose to visualize? As a reader, how does the visualization help you to better understand the information presented?
- Consider those same data visualizations, this time looking at how the writer talks about the visualization. How does the writer introduce the visualization within the text? Where is the visualization placed in relation to its textual reference?
LICENSES AND ATTRIBUTIONS
- “Data Visualizations” by Katherine McGee licensed under (CC-BY-SA 3.0)
- Dobrin, S. I., Keller, C. J., & Weisser, C. R. (2008). Technical communication in the twenty-first century. Upper Saddle River, NJ: Pearson Prentice Hall. Few, S. (2012).
- Show me the numbers: Designing tables and graphs to enlighten. (2nd ed.). Burlingame, CA: Analytics Press.
- “Data Visualization for Human Perception” by Stephen Few. In: Soegaard, Mads and Dam, Rikke Friis (eds.). "The Encyclopedia of Human-Computer Interaction, 2nd Ed.". Aarhus, Denmark: The Interaction Design Foundation. Available online at https://www.interaction-design.org/encyclopedia/data_visualization_for_human_perception.html