
2.3: How Do You Display Information?
- Page ID
- 47360

THE VALUE OF VISUAL INSTRUCTIONS
Visual instructions may or may not include text. Generally, it is good to have both because there are different learning styles. However, it can often vary depending on the intended use of the instructions. Visual instructions serve to clarify a concept that is difficult to explain using only words. Graphics may be used to show how something looks, how it should look once the step has been completed, and how something is done or constructed. Visuals can show trends or relationships, add liveliness to the project, or simply organize information. Graphics are useful since almost everyone (including children and a global audience) can understand visual instructions. Graphics are useful in instructions because people can see exactly what they need to complete.

Graphics used in business and marketing do the following:
- Minimize language barriers
- Speed up the learning curves
- Minimize human variability
- Increase instruction use rate and comprehension
- Reduce product returns
- Decrease assembly time- increase customer satisfaction
- Ease technical support
- Visualize and generalize data into understandable trends
- Increase the integrity of reports and memos
- Promote professionalism
- Ensure universal understanding
Graphics used in academia do the following:
- Make abstract ideas visible and concrete
- Connect prior knowledge and new concepts
- Provide structure for thinking, writing, discussing, analyzing, planning, and reporting
- Focus thoughts and ideas, leading to understanding and interpretation
- Help students to clarify thoughts, organize and analyze information, integrate new knowledge, and think critically
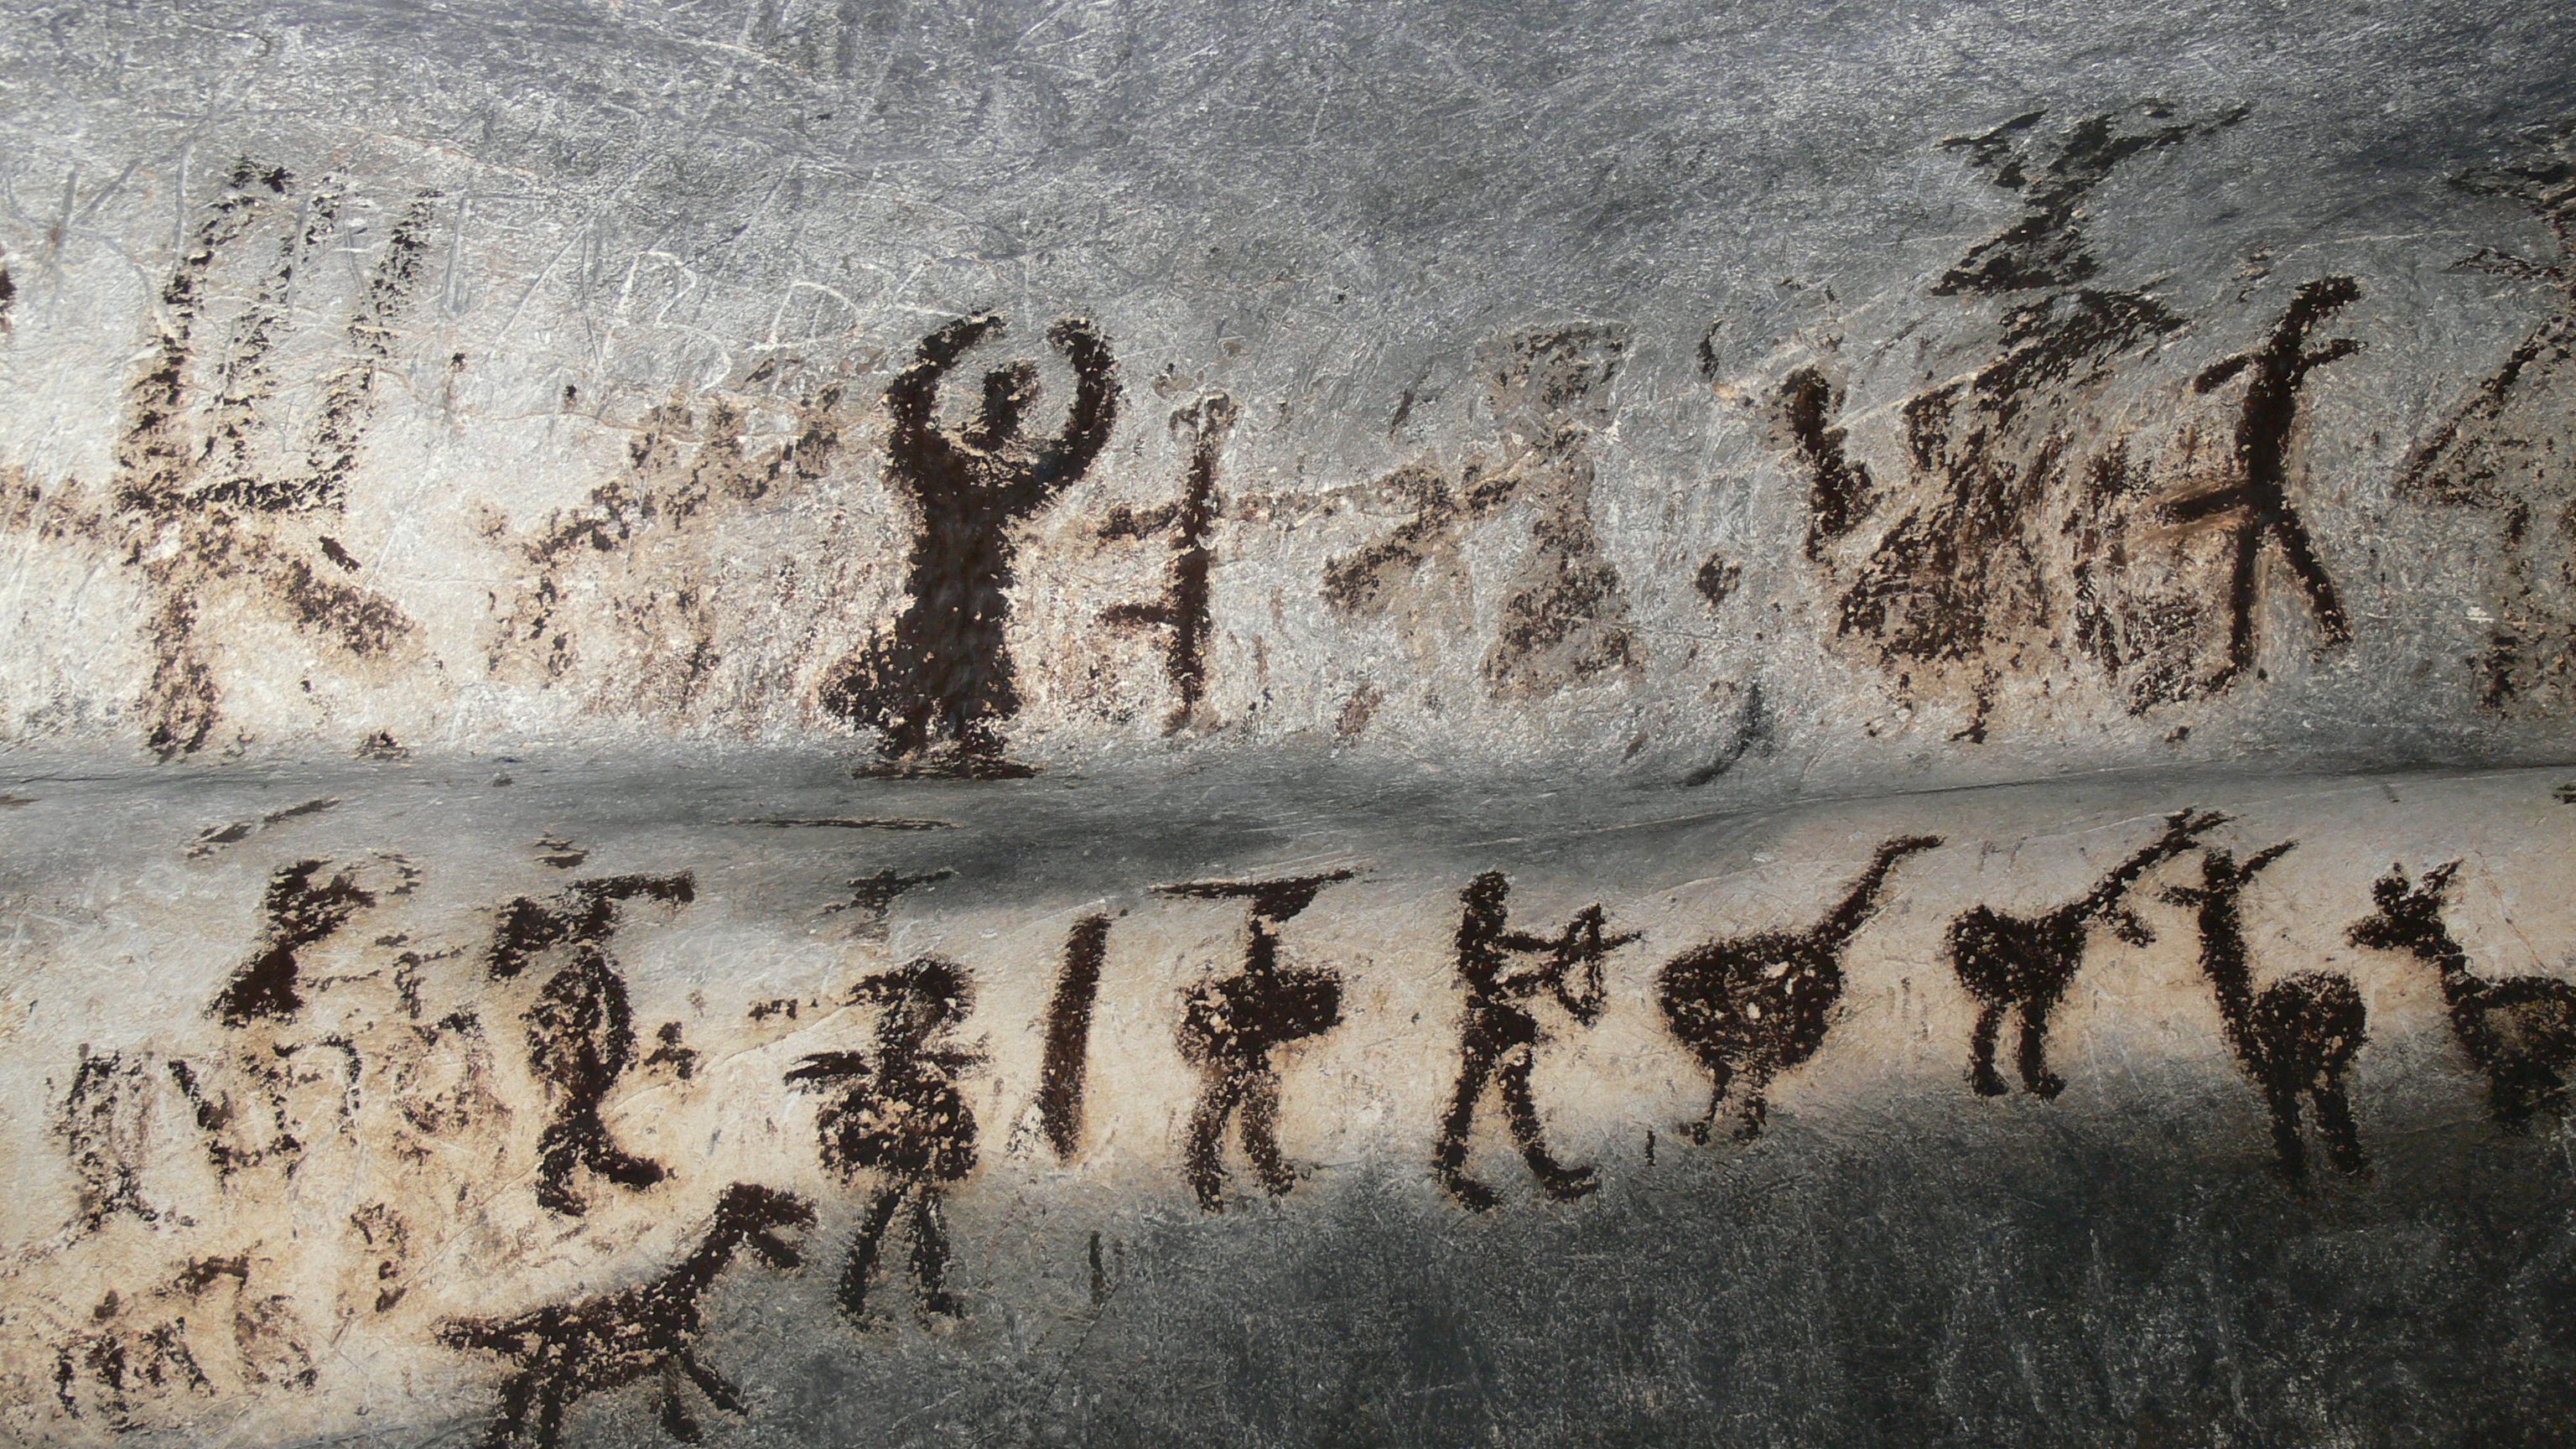
HISTORY
Graphics have been used for communicating a message or story long before written text. Graphics have a deeper impact across cultures due to their ability to create meaning from the picture, not words. Although words may be a part of the Graphic, the images themselves produce the desired response or understanding in the intended audience. Cave paintings and maps are some of the oldest that we know of and anyone that looks upon them can see what the graphic means and what it is for. A map from today would naturally look different from one in the 18th century, but the message would still be the same. The sea routes from England to Africa or the Caribbean would consist of different names, boundaries, and possessions but the audience would still find the same meaning.
COMMON PROBLEMS WITH VISUAL INSTRUCTIONS
While there are a number of benefits to visual instructions, there are also some drawbacks. When there are no words people may interpret graphics differently. Some graphics can be unclear, and this can confuse the intended audience if the process is very detailed and requires pieces that look identical. When the pictures include a lot of different pieces it is also necessary to zoom in on difficult parts in order to see them better or use exploded diagrams. If you work in a field that employs specialized graphics, use these graphics only when communicating with readers in your field who will understand and expect them (what field can you think of that fits this category?). If you are using the graphics for a wide audience (such as a board game that may be used for young children to senior citizens), make sure that the graphics you choose can be understood by all.
LICENSES AND ATTRIBUTIONS
- The Value of Visual Instructions. Provided by: WikiBooks. Located at: en.wikibooks.org/wiki/Professional_and_Technical_Writing/Instructions/Visuals#The_Value_of_Visual_Instructions. Project: Professional and Technical Writing. License: CC BY-SA: Attribution-ShareAlike